

Summing Up The Week
The stock market wobbled this week under the weight of surging inflation fears and a bond market flashing warning signs not seen in nearly two decades.
Long‑dated Treasury yields ripped to 19‑year highs, geopolitical tension kept risk appetite on ice, and even a rare, aggressive intervention from the U.S. Treasury couldn’t stop rates from grinding higher. By mid‑week, Fed minutes added fuel to the fire, hinting that more rate hikes are on deck if inflation refuses to cool.
The result?
A whipsaw stretch where stocks tried to rally on policy support, only to stumble again as yields roared back and reminded everyone that in 2026, the bond market is still very much in the driver’s seat.
Let's take a deeper dive into the news that moved markets...
Market News
Inflation worries send yields to 19-year highs
On Tuesday, the selloff which started on Monday continued as the 30-year Treasury yield traded at a new 19-year high as investors globally remain concerned about persistent inflation, reported CNBC.
The yield on the U.S. 30-year Treasury bond fell less than 1 basis point to trade at 5.305%. The 10-year Treasury note yield which serves as the main benchmark for mortgages, auto loans and credit card debt, was less than 1 basis point lower at 4.72%. The yield on the 2-year Treasury note, which typically reacts in line with short-term Federal Reserve interest rate decisions, edged down less than a basis point to 4.175%.
"Markets have seen growing weakness over the last 24 hours, with bonds and equities slipping thanks to negative geopolitical headlines from the Middle East," said Deutsche Bank’s Jim Rid in a note on Tuesday. "There wasn’t a single catalyst for the declines, but with few signs of the US and Iran coming to any sort of a deal, that meant investors priced in a more extended closure of the Strait of Hormuz."
Treasury doubles debt buybacks to steady bond market
On Wednesday, the Treasury Department announced it would double the level of government debt buybacks in the coming months as a strategy to target longer-dated yields, reported CNBC. Clearly, the increasing yields on government bonds globally has made the U.S. Treasury Department nervous as Treasury Secretary Scott Bessent stepped in to try to alleviate some of the stress on Wednesday.
"This increase in buyback operation sizes reflects Treasury’s desire to provide greater liquidity support in longer-dated nominal sectors where there is consistent strong sponsorship from market participants, as evidenced by the significant volume of high-quality offers Treasury routinely receives in longer-dated buyback operations," the department said in a statement.
Stocks initially started the day higher at the open on Wednesday as a result of the Treasury Department's efforts.
Fed minutes show hikes impending if inflation doesn't cool
On Wednesday, the Federal Reserve's meeting minutes for July showed that officials believe they will need to raise interest rates if inflation doesn't cool off, reported CNBC. Given that the most recent Consumer Price Index (CPI) and Producer Price Index (PPI) both showed inflation running much hotter than the Fed's 2% target, this scenario seems highly likely in the coming months.
"Many participants assessed that policy tightening would likely be necessary if inflation did not decline," said July's meeting summary. "Some participants commented that financial conditions might not currently be sufficiently restrictive to facilitate a return of inflation to 2 percent."
Despite the likelihood of at least one rate hike between now and the end of the year, stocks continued to rally off the Treasury's announcement to double debt buybacks.
Treasury Dept's buyback fails to stem the rise of yields
On Thursday, Treasury yields rebounded despite Bessent's intervention, showing that the bond market doesn't believe the debt buybacks will have much effect, reported CNBC. The increase in yields just proves the point that a direct intervention into any market by an outside party often doesn't have the intended effect; typically, the market sniffs out intervention and disproves it as it has in this case.
The interventions "belie the underlying structural challenges and do nothing to address them," said Senior Research Analyst at JPMorgan Chase Maia Crook in a note to clients. "While [the Treasury Department's] action forced some decline in longer-dated yields, the more lasting impact is the potential for higher risk premia reflecting a Treasury Department that is intervening in the market and moving away from its ‘regular and predictable’ tenet."
As a result, stocks weakened at the open of Thursday trading.
Next Week's Gameplan
Next week, we get new home sales on Tuesday which should give some insights into the health (or lack thereof) of the housing market, but the real data comes later in the week. On Wednesday, we will see the Personal Consumption Expenditures (PCE) index for July - the Federal Reserve's preferred gauge of inflation - followed by retail and wholesale inventories numbers on Thursday.
The biggest news investors will be eyeing comes in the form of the world's biggest company - Nvidia (NVDA) - reporting earnings on Wednesday after the bell. Nvidia's earnings reports haven't been as market-moving in the recent past, so expectations for another blowout quarter will likely prevent a great report from providing much upside while simply meeting expectations might have a negative effect. We'll have to wait to see on that one.
As far as other earnings, Wednesday's the big day for my portfolio with both Salesforce (CRM) and Crowdstrike (CRWD) reporting alongside Nvidia, my biggest single stock holding, after the market closes.
Then, join me back here next Friday as we go over all the news that moved the markets, friends!
Check out Get Irked Premium on Substack!
After providing FREE content since 2018, the time constraints of producing Investments in Play, Speculation in Play, the Pandemic Portfolio, and Stock Shopping List have become too much to continue doing for free.
On Substack, you can subscribe for FREE to have the Week in Review and Crypto Corner, now separate newsletters, sent to your email inbox at no cost. The portfolio updates and Stock Shopping List are now part of a premium subscription plan.
I hope you will join me on Substack as I continue on this exciting journey!
THANK YOU FOR YOUR ONGOING SUPPORT!
Crytpo Corner
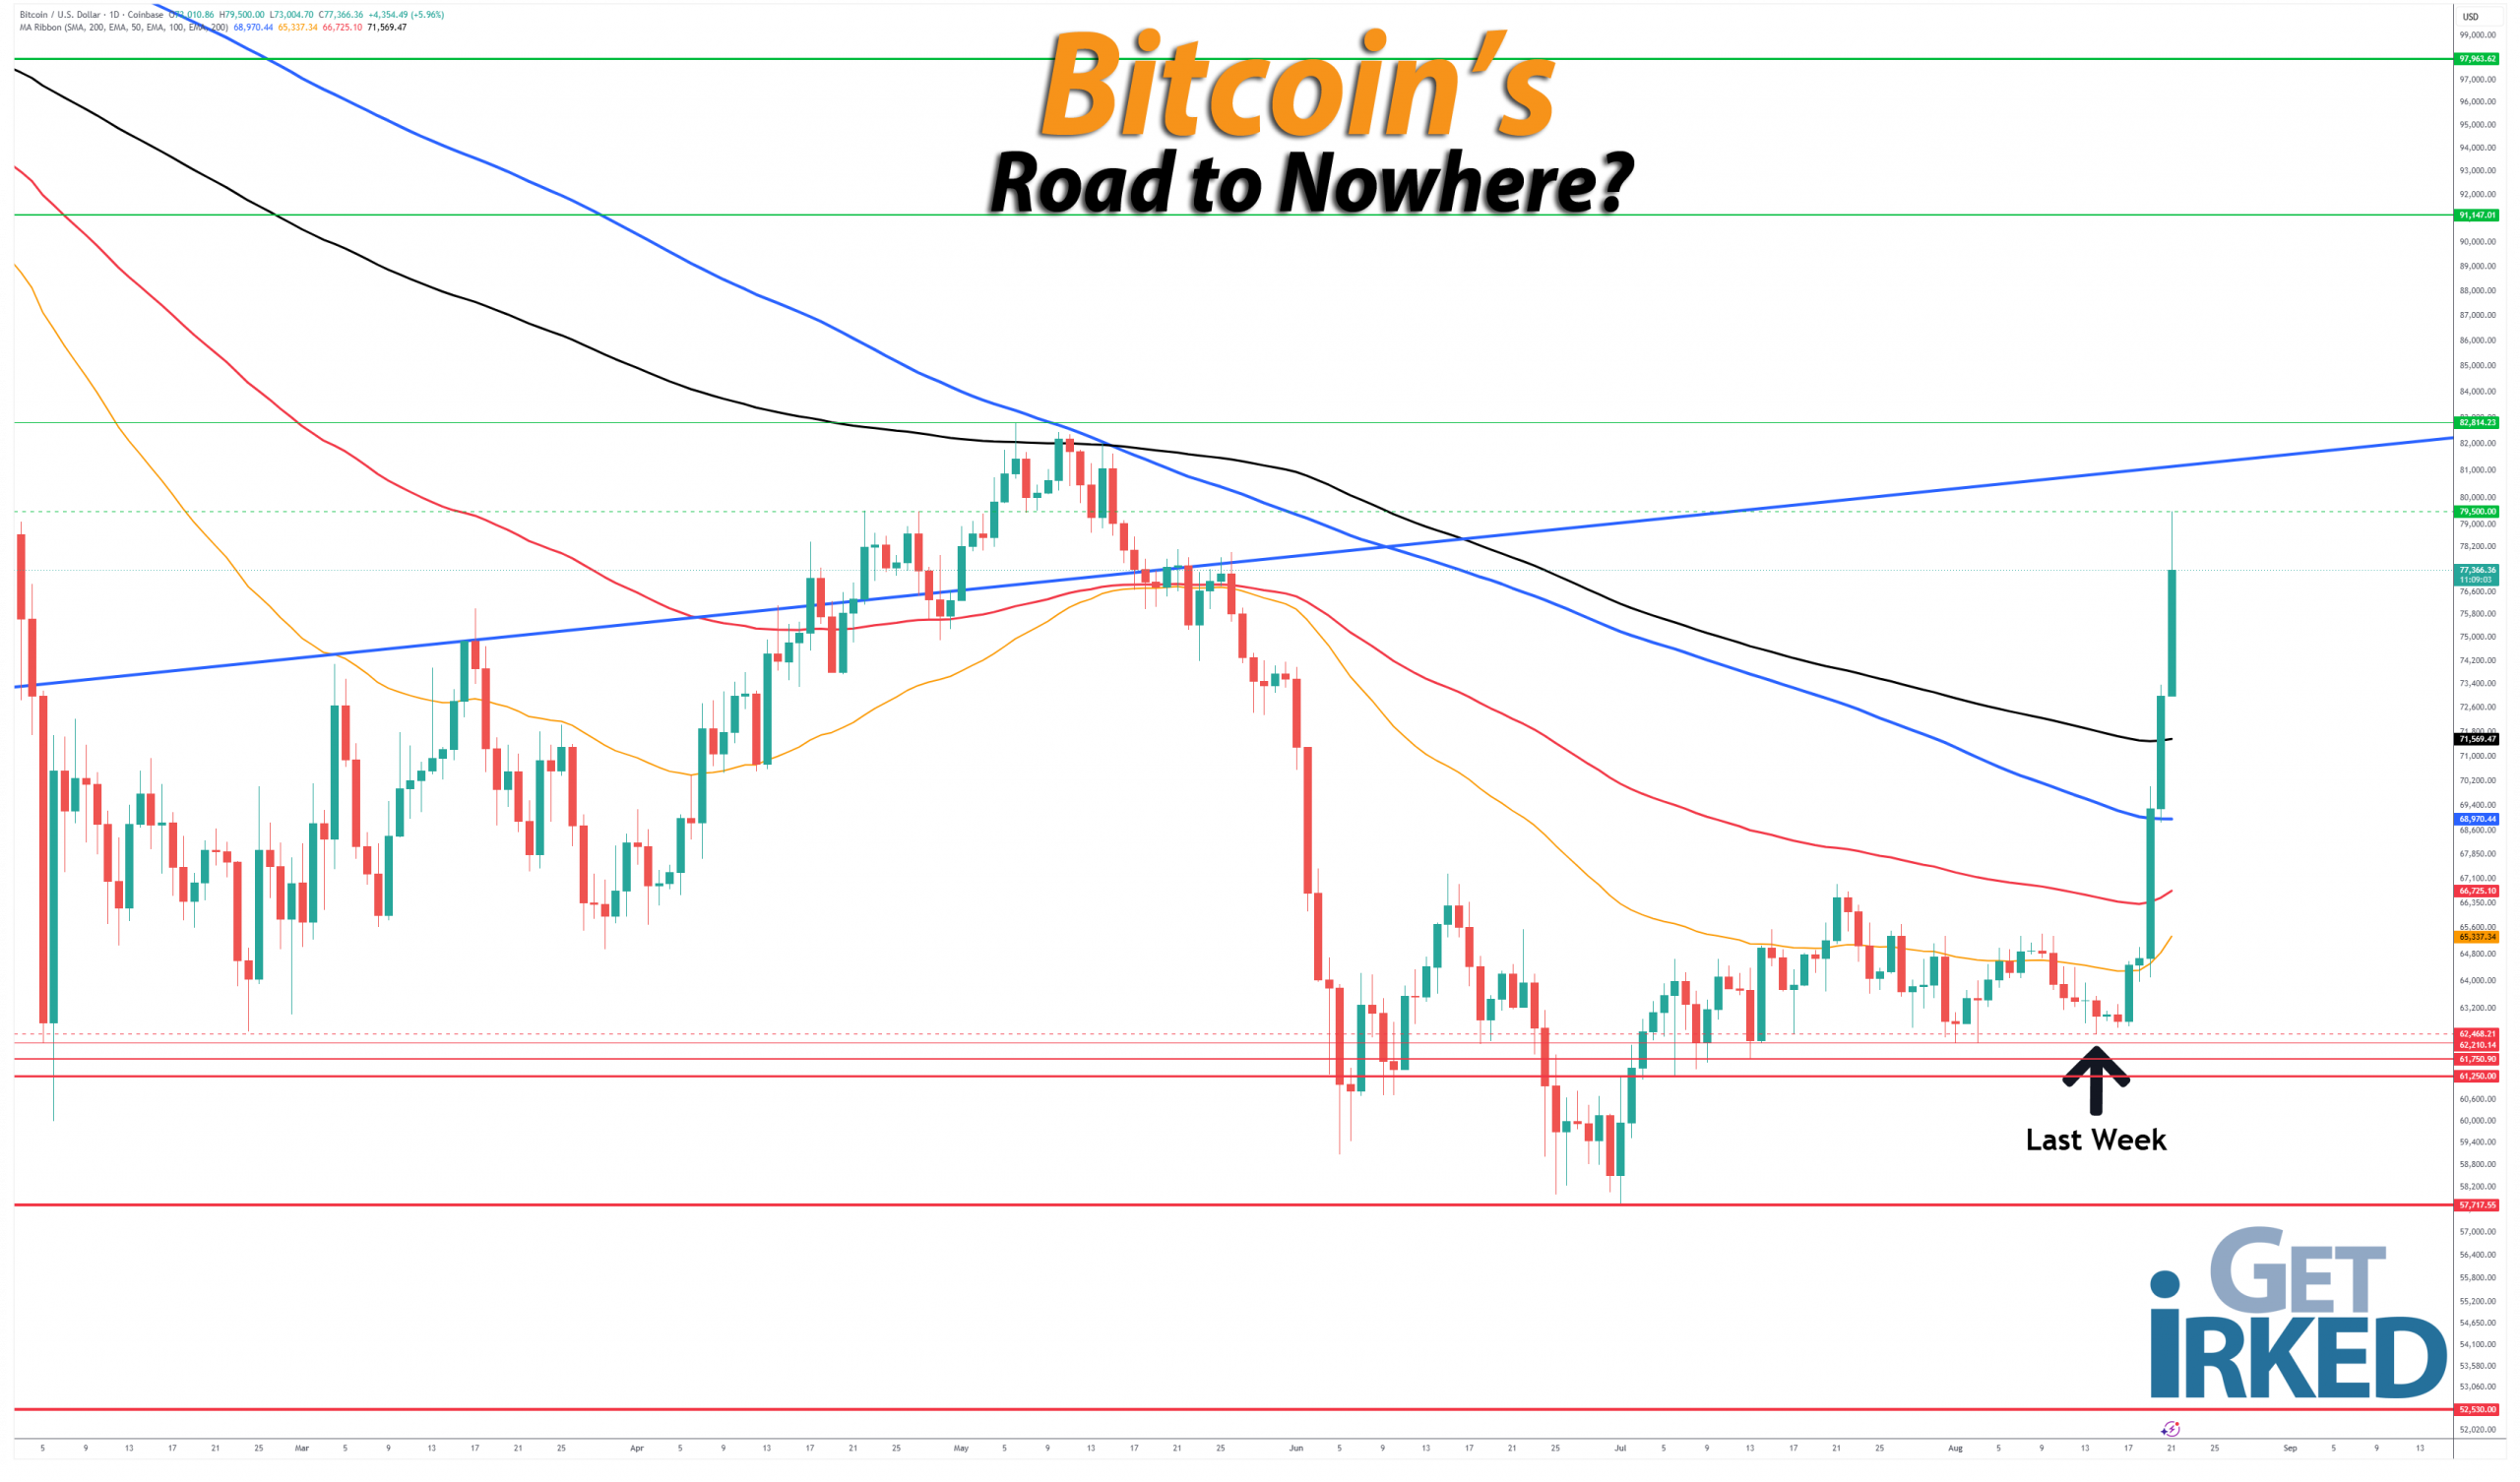
Click chart for enlarged version
Bitcoin Price (in USD)
%
Weekly Change
Bitcoin Price Action
Bitcoin broke down to a new, lower weekly-low last Friday, dipping below the prior low at $62,623.10 before finding support at $62,468.21. On Wednesday, Bitcoin finally re-correlated with gold, rallying on the back of the U.S. Treasury Department announcing extreme measures to try to get the rising yield of Treasurys under control.
Bitcoin’s rally continued with Big Orange destroying the near-term moving averages, it blew through both the 200-Day Simple and Exponential Moving Averages (SMA & EMA) before setting a much, much higher weekly-high at $79,511.10 on Friday, a level Bitcoin hasn’t traded at since mid-May.
I have been hoping for Bitcoin to re-correlate with either its “pet rock” colleague to its “digital gold” claim or, at least, to risk-on assets. Up until this week, Bitcoin ignored any upside rally in other asset classes for months, not correlating with anything but downside price action… and that’s not pleasant for any Bitcoin investor, including me.
However, despite all of the week’s constructive price action… the problem is… while I am trying to be optimistic, I still have a bearish bias.
Why am I still bearish?
Let’s take a look at the past two Crypto Winters:
-
In July 2018, Bitcoin rallied +50.38% from $5,650.00 to $8,496.60 before crashing -63.26% from that high to where it finally bottomed at $3,120.00 in December.
-
In January 2022, Bitcoin rallied +46.33% from $32,940.10 to $48,200.00 before crashing -67.90% from that high to where it finally bottomed at $15,470.50 in November.
In other words, this rally remains true to a typical Crypto Winter cycle: in past Crypto Winters, Bitcoin rallies anywhere from +46.33% to +50.38% off the low everyone thought would be the bottom only to sell off -63.26% to -67.90% from the top of that relief rally before actually bottoming for the Crypto Winter cycle.
By today’s numbers, this means Bitcoin could rally to a high anywhere from $84,490.94 (+46.33% off its current $57,740.00 cycle low) to $86,829.41 (+50.38% off the cycle low) and still roll over to crash anywhere from $31,901.13 (-63.26% from $86,829.41) to $27,121.59 (-67.90% from $84,490.94) and still be in line with the past two Crypto Winters! In fact, I discussed this exact scenario discussed a month ago in my blog: Bitcoin Could Rally To $85,000 From Here... But Still CRASH To $30,000!
It’s worth noting that 2022’s rally from the assumed cycle low to the high was less than 2018’s but the crash from that high was more than 2018’s.
In other words, the current Crypto Winter could see less of a rally than 2022’s only to roll over and crash more than the -67.90% that it crashed in 2022.
Just for reference, a -67.90% crash from the current rally high of $79,511.10 (+25.44% off the current cycle low of $57,740.00) made earlier this week would take Bitcoin to a cycle low of $25,523.06 and that’s if Bitcoin “only” crashes the same amount from its rally high that it did in 2022.
If 2026 repeats 2022, the crash could be even more severe! 2022’s crash was 7.33% greater than 2018’s. If that same thing happened in 2026, the cycle bottom could be -72.88% lower (7.33% greater than -67.90%).
With the rally high at $79,511.10 this would give us a cycle low target of $21,563.41!
Combine the Crypto Winter patterns with the fact that we’re headed into the seasonally weakest times for markets where stocks typically sell off from late-August to late-October plus the fact that Bitcoin’s final crash in both 2018 and 2022 started in early November and you’ve got a recipe to keep me in the bear camp a while longer.
When might I get bullish?
I really like the setup of the 50-Day and 200-Day Simple Moving Averages (SMA) with Bitcoin having broken above both of them. If the Bulls can turn the 200-Day EMA from into support upon a potential retest and head higher from there, that would be incredibly constructive for Bitcoin.
However, as I wrote above, we’re still far from out of the woods. There is another key moving average on the Weekly timeframe which will provide resistance around $81.5K. Bulls will have to contend with that new level, and the longer the timeframe, the more challenging it tends to be for Bulls to flip resistance into support.
In other words, there’s a lot of wood to chop, but with volatility finally reigniting in Bitcoin, we’re finally getting to see some price action which inspires adding to positions while always strictly following risk management discipline.
Bitcoin Trade Update
Premium subscribers to Get Irked get access to all the moves I've made in my Bitcoin trade over the past week as well as my next thirty (30) ... yes, 30 ... buys in Bitcoin including price levels, quantities, and a full layout of my ongoing long-term trade in the world's biggest crypto.
Not Your Keys, Not Your Crypto...
In light of brokerage failures in 2022, I no longer keep any of my crypto on an exchange and I only keep enough USD on the exchanges I use to execute my next few buys. I use multiple cold wallets from the brands Ledger and Trezor to hold my crypto (click the links to access the direct sites, and I receive no affiliate benefits from these links).
No price target is unrealistic in the cryptocurrency space – Bullish or Bearish.
While traditional stock market investors and traders may think the price targets in the cryptocurrency space are outlandish due to the incredible spread (possible moves include drops of -90% or more and gains of +1000% or more), Bitcoin has demonstrated that, more than any speculative asset, its price is capable of doing anything.
Here are some of Bitcoin's price movements over the past couple of years:
- In 2017, Bitcoin rose +2,707% from its January low of $734.64 to make an all-time high of $19,891.99 in December.
- Then, Bitcoin crashed nearly -85% from its high to a December 2018 low of $3128.89.
- In the first half of 2019, Bitcoin rallied +343% to $13,868.44.
- In December, Bitcoin crashed -54% to a low of $6430.00 in December 2019.
- In February 2020, Bitcoin rallied +64% to $10,522.51.
- In March , Bitcoin crashed nearly -63% to a low of $3858.00, mostly in 24 hours.
- Then, Bitcoin rallied +988% to a new all-time high of $41,986.37 in January 2021.
- Later in January 2021, Bitcoin dropped -32% to a low of $28,732.00.
- In February, Bitcoin rallied +103% to a new all-time high of $58,367.00.
- Later in February, Bitcoin dropped -26% to a low of $43,016.00.
- In April , Bitcoin rallied +51% to a new all-time high of $64,896.75.
- In June , Bitcoin crashed -56% to a low of $28,800.00.
- In November, Bitcoin rallied +140% to a new all-time high of $69,000.00.
- In November 2022, Bitcoin crashed -78% to a low of $15,460.00.
- In April 2023, Bitcoin rallied +101% to a high of $31,050.00.
- In June, Bitcoin dropped -20% to a low of $24,750.00
- In July, Bitcoin rallied +29% to a high of $31,862.21.
- In September, Bitcoin dropped -22% to a low of $24,900.00.
- In January 2024, Bitcoin rallied +97% to a high of $49,102.29.
- Later in January, Bitcoin dropped -22% to a low of $38,501.00.
- In March, Bitcoin rallied +92% to a new all-time high of $73,835.57.
- In August, Bitcoin dropped -33% to a low of $49,050.01.
- In January 2025, Bitcoin rallied +150% to a new all-time high of $109,358.01.
- In April, Bitcoin dropped -32% to a low of $74,420.69.
- In May, Bitcoin rallied +51% to a new all-time high of $112,000.00.
- In June, Bitcoin dropped -12% to a low of $98,247.01.
- In July, Bitcoin rallied +25% to a new all-time high of $123,231.07.
- In September, Bitcoin dropped -14% to a low of $107,250.00.
- In October, Bitcoin rallied +18% to a new all-time high of $126,296.00.
- In July 2026, Bitcoin dropped -54% to a low of $57,717.55.
Where will Bitcoin go from here? Truly, anything is possible…
What if Bitcoin’s headed to zero?
The only reason I speculate in the cryptocurrency space is I truly believe Bitcoin isn’t headed to zero.
I am prepared for that possibility, however, by knowing I could potentially lose all of the capital I’ve allocated to this speculative investment. Professional advisers recommend speculating with no more than 5% of an investor’s overall assets. Personally, I’ve allocated less than that to speculating in crypto.
I feel that anyone who doesn’t fully believe in the long-term viability of cryptocurrency would be better served not speculating in the space.
On a good day, this asset class isn’t suitable for those with weak stomachs. On volatile days, the sector can induce nausea in the most iron-willed speculator. If a speculator isn’t confident in the space, the moves will cause mistakes to be made.
DISCLAIMER: Anyone considering speculating in the crypto sector should only do so with funds they are prepared to lose completely. All interested individuals should consult a professional financial adviser to see if speculation is right for them. No Get Irked contributor is a financial professional of any kind.
Ways to give back to GetIrked:
Send me a tip via Stripe! Thank you!
Get free money by signing up for an account with my referral link for Schwab
Sign up for Gemini and we each get $10
Click this referral link to get the Brave Browser
If you use Brave, you can also use the Tip function to tip me in Basic Attention Token (BAT).
Suicide Hotline - You Are Not Alone
Studies show that economic recessions cause an increase in suicide, especially when combined with thoughts of loneliness and anxiety.
If you or someone you know are having thoughts of suicide or self-harm, please contact the National Suicide Prevention Lifeline by visiting www.suicidepreventionlifeline.org or calling 1-800-273-TALK.
The hotline is open 24 hours a day, 7 days a week.

You must be logged in to post a comment.