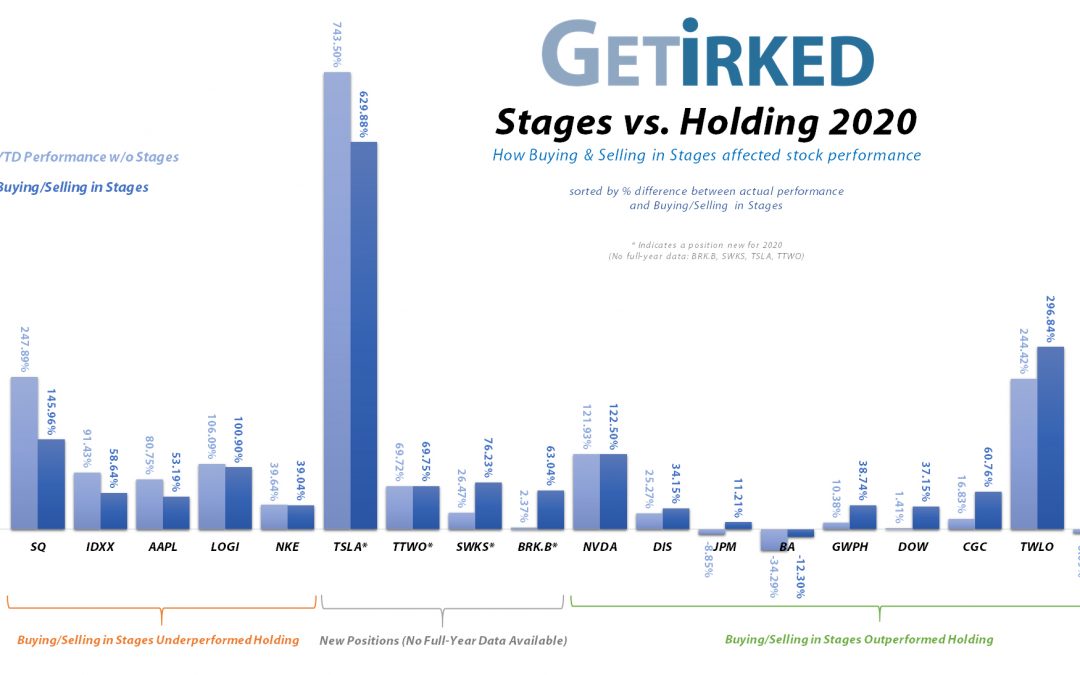
How did Buying and Selling in Stages do in 2020? The below chart shows the overall performance of my Investments in Play portfolio in two ways: 1. The light blue bar shows how the position fared if an investor bought at the beginning of the year and held for the...
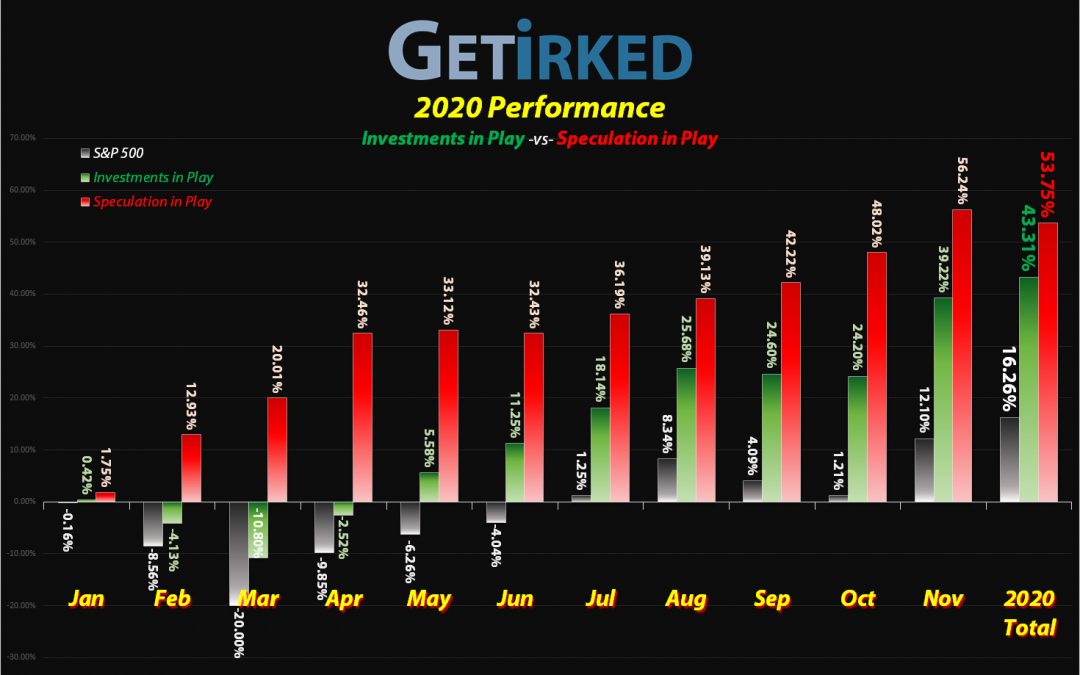
Get Irked Destroyed the S&P 500 in 2020 Speculation in Play: +53.75% Investments in Play: +43.31% S&P 500: +16.26% Click on the chart to enlarge it for a bigger view The most overused word to describe the events of 2020 was definitely...
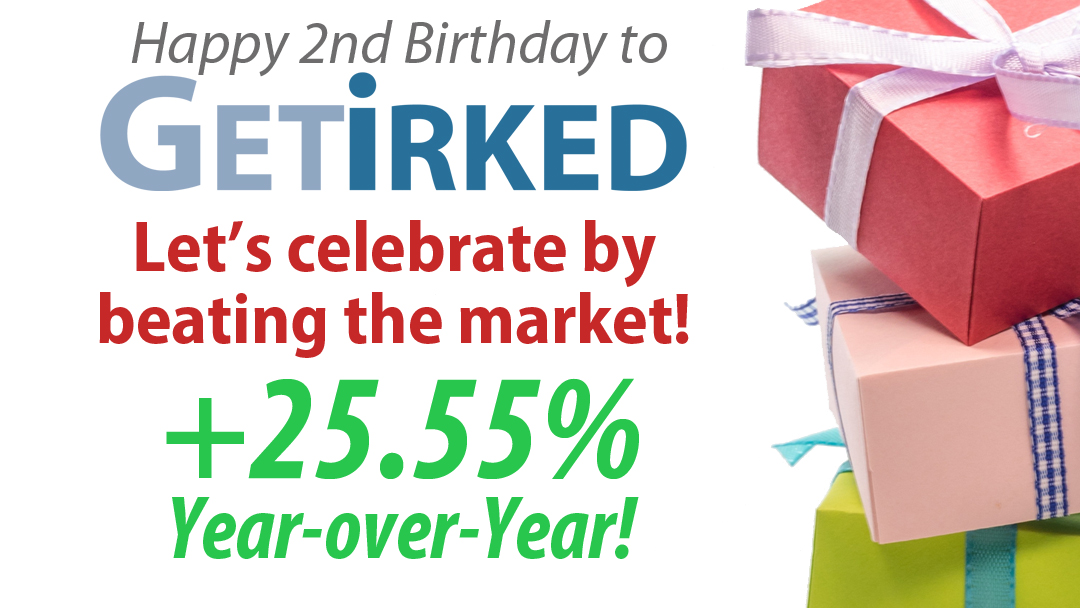
Click chart for enlarged version Happy 2nd Birthday, GetIrked! Last year, I started the practice of reviewing Get Irked’s performance on the anniversary of when I first started the website – August 8, 2018. This year, I wanted to do the same, the...
Originally posted in Week in Review #95 on Friday, June 12, 2020 Black Lives Matter While I try to stick closely to the matters affecting the markets on Get Irked, the horrific murders of George Floyd, Breonna Taylor, Ahmaud Arbery, and so many other black Americans...
Click on the chart to enlarge it for a bigger view I Didn’t Beat the Markets This Year… or did I?? This year, I fought the market and the market won, but just barely. Where the S&P 500 earned an astounding +28.88% for the year, my Investments in Play...
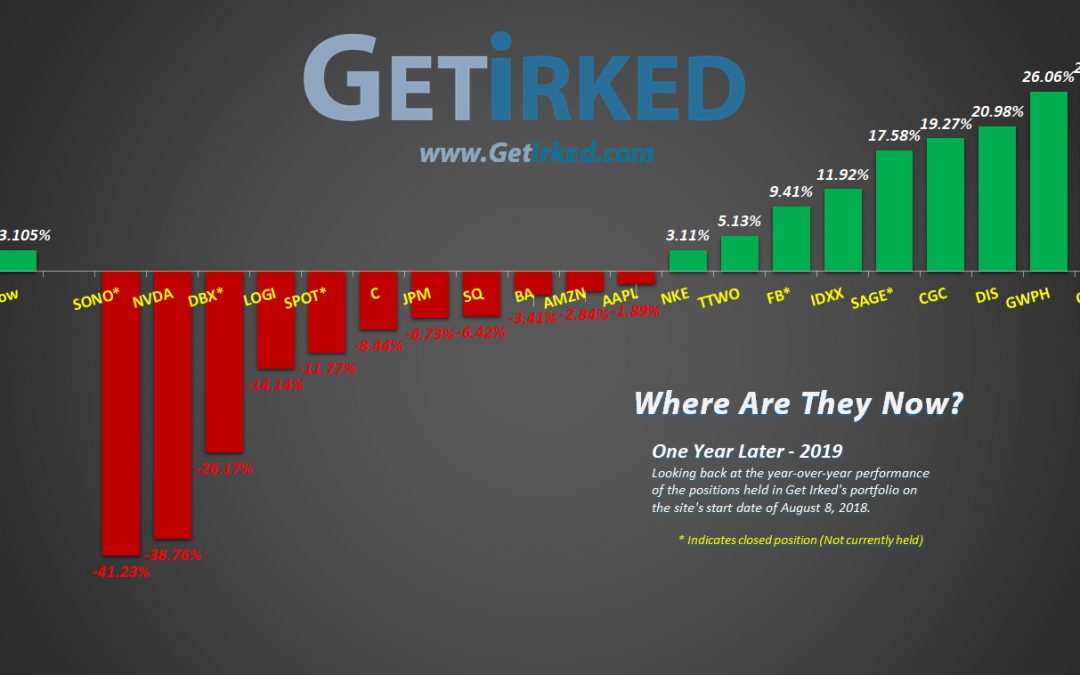
Click chart for enlarged version Where Are They Now? One Year Later… One year ago on August 8, 2018, Get Irked was launched and I’ve been chronicling my portfolios’ moves in the markets at least once a week since that date. So, now that it’s...