How did Buying and Selling in Stages do in 2020?
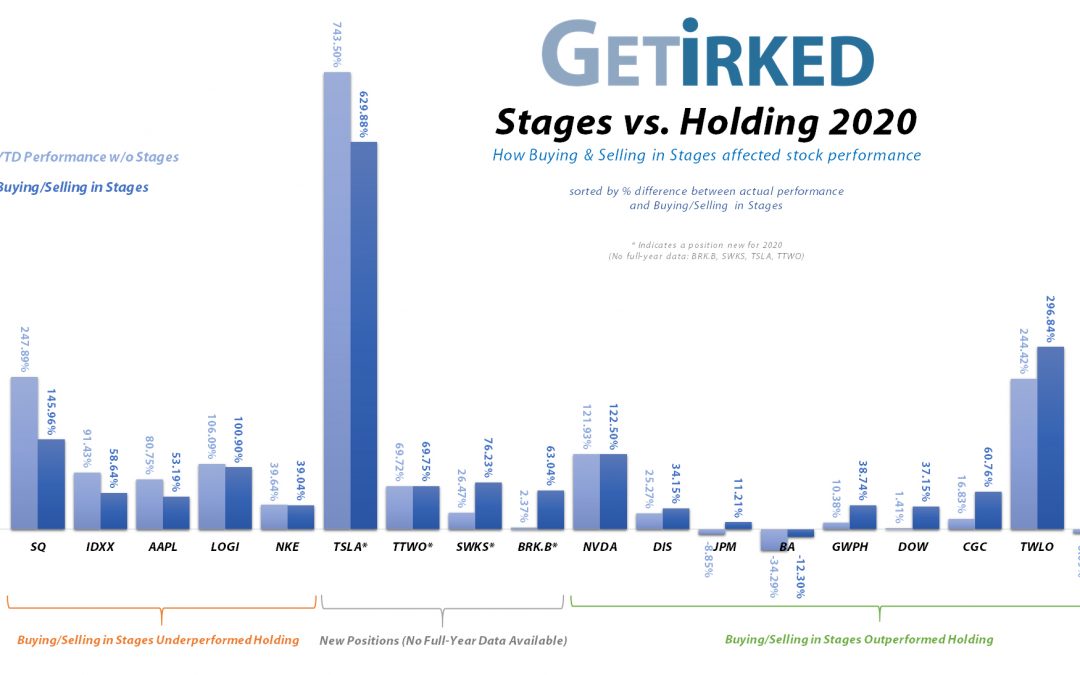
The below chart shows the overall performance of my Investments in Play portfolio in two ways:
1. The light blue bar shows how the position fared if an investor bought at the beginning of the year and held for the entire year.
2. The dark blue bar shows how I fared by Buying and Selling in Stages using the market's volatile swings throughout the year.
The calculation of the performance in Buying in Stages and Selling in Stages is based on the profit of my position from the beginning of the year to the end. In other words, adding more to a position wouldn't help improve its gain unless the overall profit after costs gained.
Likewise, ending the year with a smaller position with greater profits would still result in a lesser % gain as holding the entire position would have been more effective.
This section is really eye-opening to how powerful Buying and Selling in Stages can be to improve overall performance. Out of the 15 qualified positions held for the entire year, 10 of them saw bigger gains or lesser losses when compared with buying-and-holding. Only 5 of my positions saw worse performance than buying-and-holding.
You may notice that Berkshire Hathaway (BRK.B), Skyworks Solutions (SWKS) Take Two Interactive (TTWO), and Tesla (TSLA) didn't make either list. This is due to the fact they were purchased throughout the year. Without a full-year comparison, the results would not be truly comparable.

Click on the chart to enlarge it for a bigger view
Top 3 Buying & Selling Winners
Biggest Winner #1: Salesforce.com (CRM)
I added to Salesforce.com (CRM) during the March selloff at $151.19 on March 10 and again at $128.83 on March 16. The stock closed the year at $222.53.
The result?
Salesforce.com saw a +36.82% gain from the start of 2020, but my position gained +110.92% from the start of the year, a difference of return 74.1%.
Biggest Winner #2: IBM (IBM)
Like Salesforce.com (CRM), I added to IBM (IBM) during the selloff. I started earlier, buying at $126.90 on February 28, a second time at $118.17 on March 10, and a third time at $106.07. The stock closed the year at $125.88
The result?
IBM saw a loss of -6.09% from where it started the year, but thanks to Buying in Stages (and IBM's plentiful dividend), my position is up +51.88% from where it started the year, a difference of return of 57.97%.
Biggest Winner #3: Twilio (TWLO)
Twilio (TWLO) is a great example of both Buying and Selling in Stages. I sold the majority of the position on January 21 for $119.32. Then, I bought back in, adding to the position at $92.13 on March 10 and $77.00 on March 12. On May 7, I sold some of the position at $159.59 to lock in the more than double move TWLO had off its March lows.
The result?
TWLO closed the year at $338.50 for an impressive +244.42% gain. My position, however, started the year down, so the combination of buying and selling in stages resulted in a 296.84% gain on my existing position for the year, a difference of return of 52.42%.
Greatest Loss Reduction: Boeing (BA)
Buying and Selling in Stages doesn't just work in profitable stocks, it can also substantially mitigate losses. The biggest loser in 2020 was Boeing (BA), without a question.
Boeing (BA) entered the year beleaguered, still recovering from two fatal plane crashes and an investigation that revealed company problems stemming from the top to the bottom. Then, the pandemic hit.
Boeing started the year at $325.76. At its March low, Boeing had lost an epic -72.68% of its value, dropping to $89.00. It recovered admirably, closing the year down "only" -34.29%, a pretty remarkable bounce off its low but still an awful loss.
Comparatively, I bought during the selloff starting far too early at $306.40 on February 25, early again at $277.07 on February 28, again on March 9 at $232.35, a fourth time at $160.32 on March 12, and a final time at $126.99 on May 4.
The result?
Whereas Boeing closed the year down -34.29%, my position closed the year down -12.90%. While that's far from great, Buying and Selling in Stages my loss by a difference of -21.39%.
Top 3 Buying & Selling Losers
Biggest Loser #1: Square (SQ)
Square (SQ) pulled off a remarkable year that positively no one could have predicted. It started the year at $62.56, crashed -48.32% to $32.33 during its March low, then rocketed +573.18% to finish the year at $217.64.
Square (SQ) is the largest position in my portfolio with my first buy shortly after it came public in 2016, buying at $11.10 on August 5, 2016.
During the selloff, I added to SQ liberally:
March 9 @ $64.02
March 12 @ $55.87
March 16 @ $46.03
March 18 @ $34.52
However, when Square bounced back and broke through its previous all-time high way down at "only" $101.15, I took profits to limit the size of the allocation in my portfolio, one of my other key strategies.
From April through December, I made sales starting at $59.75 on April 9 and ending at $241.69 on December 22.
The result?
My position is up +145.96% where holding would have netted the position an astounding gain of +247.89%, a missed return of 101.93%! However, given that my position is up +962.81% over its lifetime, I'll satisfy myself with my "consolation prize."
Biggest Loser #2: IDEXX Laboratories (IDXX)
IDEXX Laboratories (IDXX) started the year at $259.90, dropped -35.11% to its March low of $168.65, and then exploded +296.39% to finish the year at $499.87, near its all-time high.
I added to my position on the way down starting on March 16 at $233.09, March 19 at $190.27, and March 23 at $170.18.
When IDXX bounced in April, I started taking profits at $275.31 on April 27, $300.19 on May 27, $367.87 on July 22, $460.39 on November 4, and $470.82 on November 6 (removing all initial capital in the position).
The result?
IDXX closed the year +91.43% and my position was up +58.64%, a missed return of 32.79%.
Biggest Loser #3: Apple (AAPL)
Apple (AAPL) had a very good year as its services revenue stream really took off. Apple started the year at $73.41, dropped -27.60% to $53.15 at its March lows, and leapt +249.65% to close the year at $132.69.
I added to my position on February 28 at $64.99 and March 20 at $58.24. I then took profits at $73.01 on April 30, $80.58 on June 2, and $99.94 on July 13.
The result?
AAPL closed the year up +80.75% while my position finished +53.19%, a missed return of 27.56%.
Stay Tuned to Get Irked to Learn More!
![]()
Disclaimer: Eric "Irk" Jacobson and all other Get Irked contributors are not investment or financial advisers. All strategies, trading ideas, and other information presented comes from non-professional, amateur investors and traders sharing techniques and ideas for general information purposes.
As always, all individuals should consult their financial advisers to determine if an investing idea is right for them. All investing comes with levels of risk with some ideas and strategies carrying more risk than others.
As an individual investor, you are accountable for assessing all risk to determine if the strategy or idea fits with your investment style. All information on Get Irked is presented for educational and informational purposes only.
You must be logged in to post a comment.