

Summing Up The Week
The stock market didn’t just wake up this week, it was jolted awake. Trump’s sudden reinstatement of the Strait of Hormuz blockade sent oil ripping above $75 and stocks tumbling out of the gate, igniting a geopolitical shockwave that collided head‑on with a pair of surprisingly cool inflation reports.
CPI and PPI both delivered rare pockets of relief, hinting that disinflation still has some fight left in it… even as the Iran conflict threatens to snuff it out. By midweek, stocks and Bitcoin were clawing their way higher only to get blindsided Friday when jittery AI investors triggered a semiconductor selloff with no real catalyst.
It was a whipsaw of a week, the kind that punishes complacency, rewards discipline, and hands out fresh buying opportunities to anyone brave enough to lean in.
Let's take a deeper dive into the news that moved markets this week...
Market News
Trump reinstates blockade on Iranian ships
The week kicked off with a bang when President Donald Trump reinstated the Strait of Hormuz blockade on Iranian ships causing U.S. oil to rally above $75 a barrel and the S&P 500 to plummet, reported CNBC.
Trump reinstated the blockade after Iran's ongoing drone attacks on container ships passing through the strait. "We are reinstating the THE IRANIAN BLOCKADE, so named because it is only stopping Iran’s ships or customers from entering or leaving. All other countries will have fair and open use of the Strait," Trump posted on TruthSocial.
U.S. military forces went to great lengths to emphasize that Iran was no longer in control of the strait, "U.S. forces are positioned and prepared to ensure that freedom of navigation remains available despite unwarranted Iranian aggression, harassment, threats, and arbitrary declarations," Centcom (Central Command) said in a social media post Sunday. "Iran does not control the strait. Traffic is flowing."
As a result, the cost of U.S. oil rallied on Monday while stocks sold off on concerns that the geopolitical strife is far from over.
Consumer prices rose 3.5% in June, less than expected
On Tuesday, the Consumer Price Index (CPI) showed prices increased 3.5% annually in June against expectations for 3.8% on the back of easing energy costs, reported CNBC. Of course, with the U.S.-Iran conflict resurging, the question of how long those easing energy costs will support disinflation now remains up in the air.
"June finally brought some relief on inflation," said Heather Long, Chief Economist at Navy Federal Credit Union. "This takes the pressure off the Federal Reserve and allows the central bank to wait and see what happens. The concern is that this relief will be short-lived as the war in Iran re-starts. It’s too uncertain to know how the inflation story ends."
After stocks sold off Monday thanks to Trump's reinstatement of the Strait of Hormuz blockade, the markets rallied into the start of Tuesday trading on the back of easing inflation numbers... even if that easing may be short-lived.
Producer prices fell unexpectedly in June, thanks to energy costs
On Wednesday, the Producer Price Index (PPI) provided more relief on inflation as producer prices declined -0.3% in June versus expectations for an unchanged reading, reported CNBC. Decreasing energy costs caused disinflation (a slowing rate of inflation) for producers throughout the month according to the Bureau of Labor Statistics (BLS).
The PPI posted a 0.3% decline for June, compared to the Dow Jones consensus estimate for the final-demand cost measure to be unchanged. On an annual basis, the index indicated a 5.5% inflation rate. The May reading was also revised lower, from an initially reported increase of 1.1% to 0.6%.
"The Fed’s war with inflation isn’t over by any means," said Chris Rupkey, Chief Economist at Fwdbonds, "... but there is good news from the front and the odds of Fed rate hikes should continue to recede as inflation at the factory level is trending lower, and producers will not be passing on their higher costs to the consumer level as much as we previously thought."
Stocks and Bitcoin, which had been rallying the day prior thanks to a cooler-than-expected CPI, continued their upward trajectory ahead of the market open on Wednesday morning,
AI pullback spurs market-wide selloff
On Friday, the stock market sold off on the back of nervous AI investors selling down semiconductor stocks with no real news catalyst, reported CNBC.
Some market pundits pointed to open-source Large Language Models (LLM) making progress in China as the culprit (although I'm doubtful of this - I think it was simply selling begetting selling). "The latest development is competition from open-source models in China, which are reportedly rivaling the performance of leading offerings from Anthropic and OpenAI, raising fresh concerns about the heavy pace of technology spending,” said Angelo Kourkafas, Senior Investment Strategist at Edward Jones. "We are seeing signs of fatigue, with end-user demand for AI becoming more price sensitive and the market starting to penalize companies that are ramping spending too aggressively," he continued. "We view this volatility as a signal that the AI theme is likely maturing rather than breaking, which is a healthy part of how transformative investment cycles evolve."
The pullback opened up several buying opportunities across almost all of my portfolios including two new positions in my flagship Investments in Play portfolio: Intuitive Surgical (ISRG) and Oracle (ORCL).
Next Week's Gameplan
It's a good thing we're back in Earnings Season because there's almost nothing coming out next week in terms of datapoints. Sure, we get initial jobless claims on Thursday and S&P flash services & manufacturing PMIs on Friday, but that's actually it outside of unpredictable geopolitical headlines.
As for earnings, here's what I'll be watching from my portfolios:
Tuesday: Schwab (SCHW) reports Before Market Open (BMO).
Wednesday: CME Group (CME) reports BMO. Crown Castle (CCI), Google (GOOGL), IBM (IBM), Tesla (TSLA), and Waste Connections (WCN) report After Market Close (AMC).
Thursday: Dow Chemical (DOW) and Union Pacific (UNP) report BMO. Digital Realty Trust (DLR), Intel (INTC), and Newmont Gold (NEM) report AMC.
So, there you have it. Given the uncertainty of current world events, I expect we'll have plenty to talk about when we reconvene next Friday!
Check out Get Irked Premium on Substack!
After providing FREE content since 2018, the time constraints of producing Investments in Play, Speculation in Play, the Pandemic Portfolio, and Stock Shopping List have become too much to continue doing for free.
On Substack, you can subscribe for FREE to have the Week in Review and Crypto Corner, now separate newsletters, sent to your email inbox at no cost. The portfolio updates and Stock Shopping List are now part of a premium subscription plan.
I hope you will join me on Substack as I continue on this exciting journey!
THANK YOU FOR YOUR ONGOING SUPPORT!
Crytpo Corner
Click chart for enlarged version
Bitcoin Price (in USD)
%
Weekly Change
Bitcoin Price Action
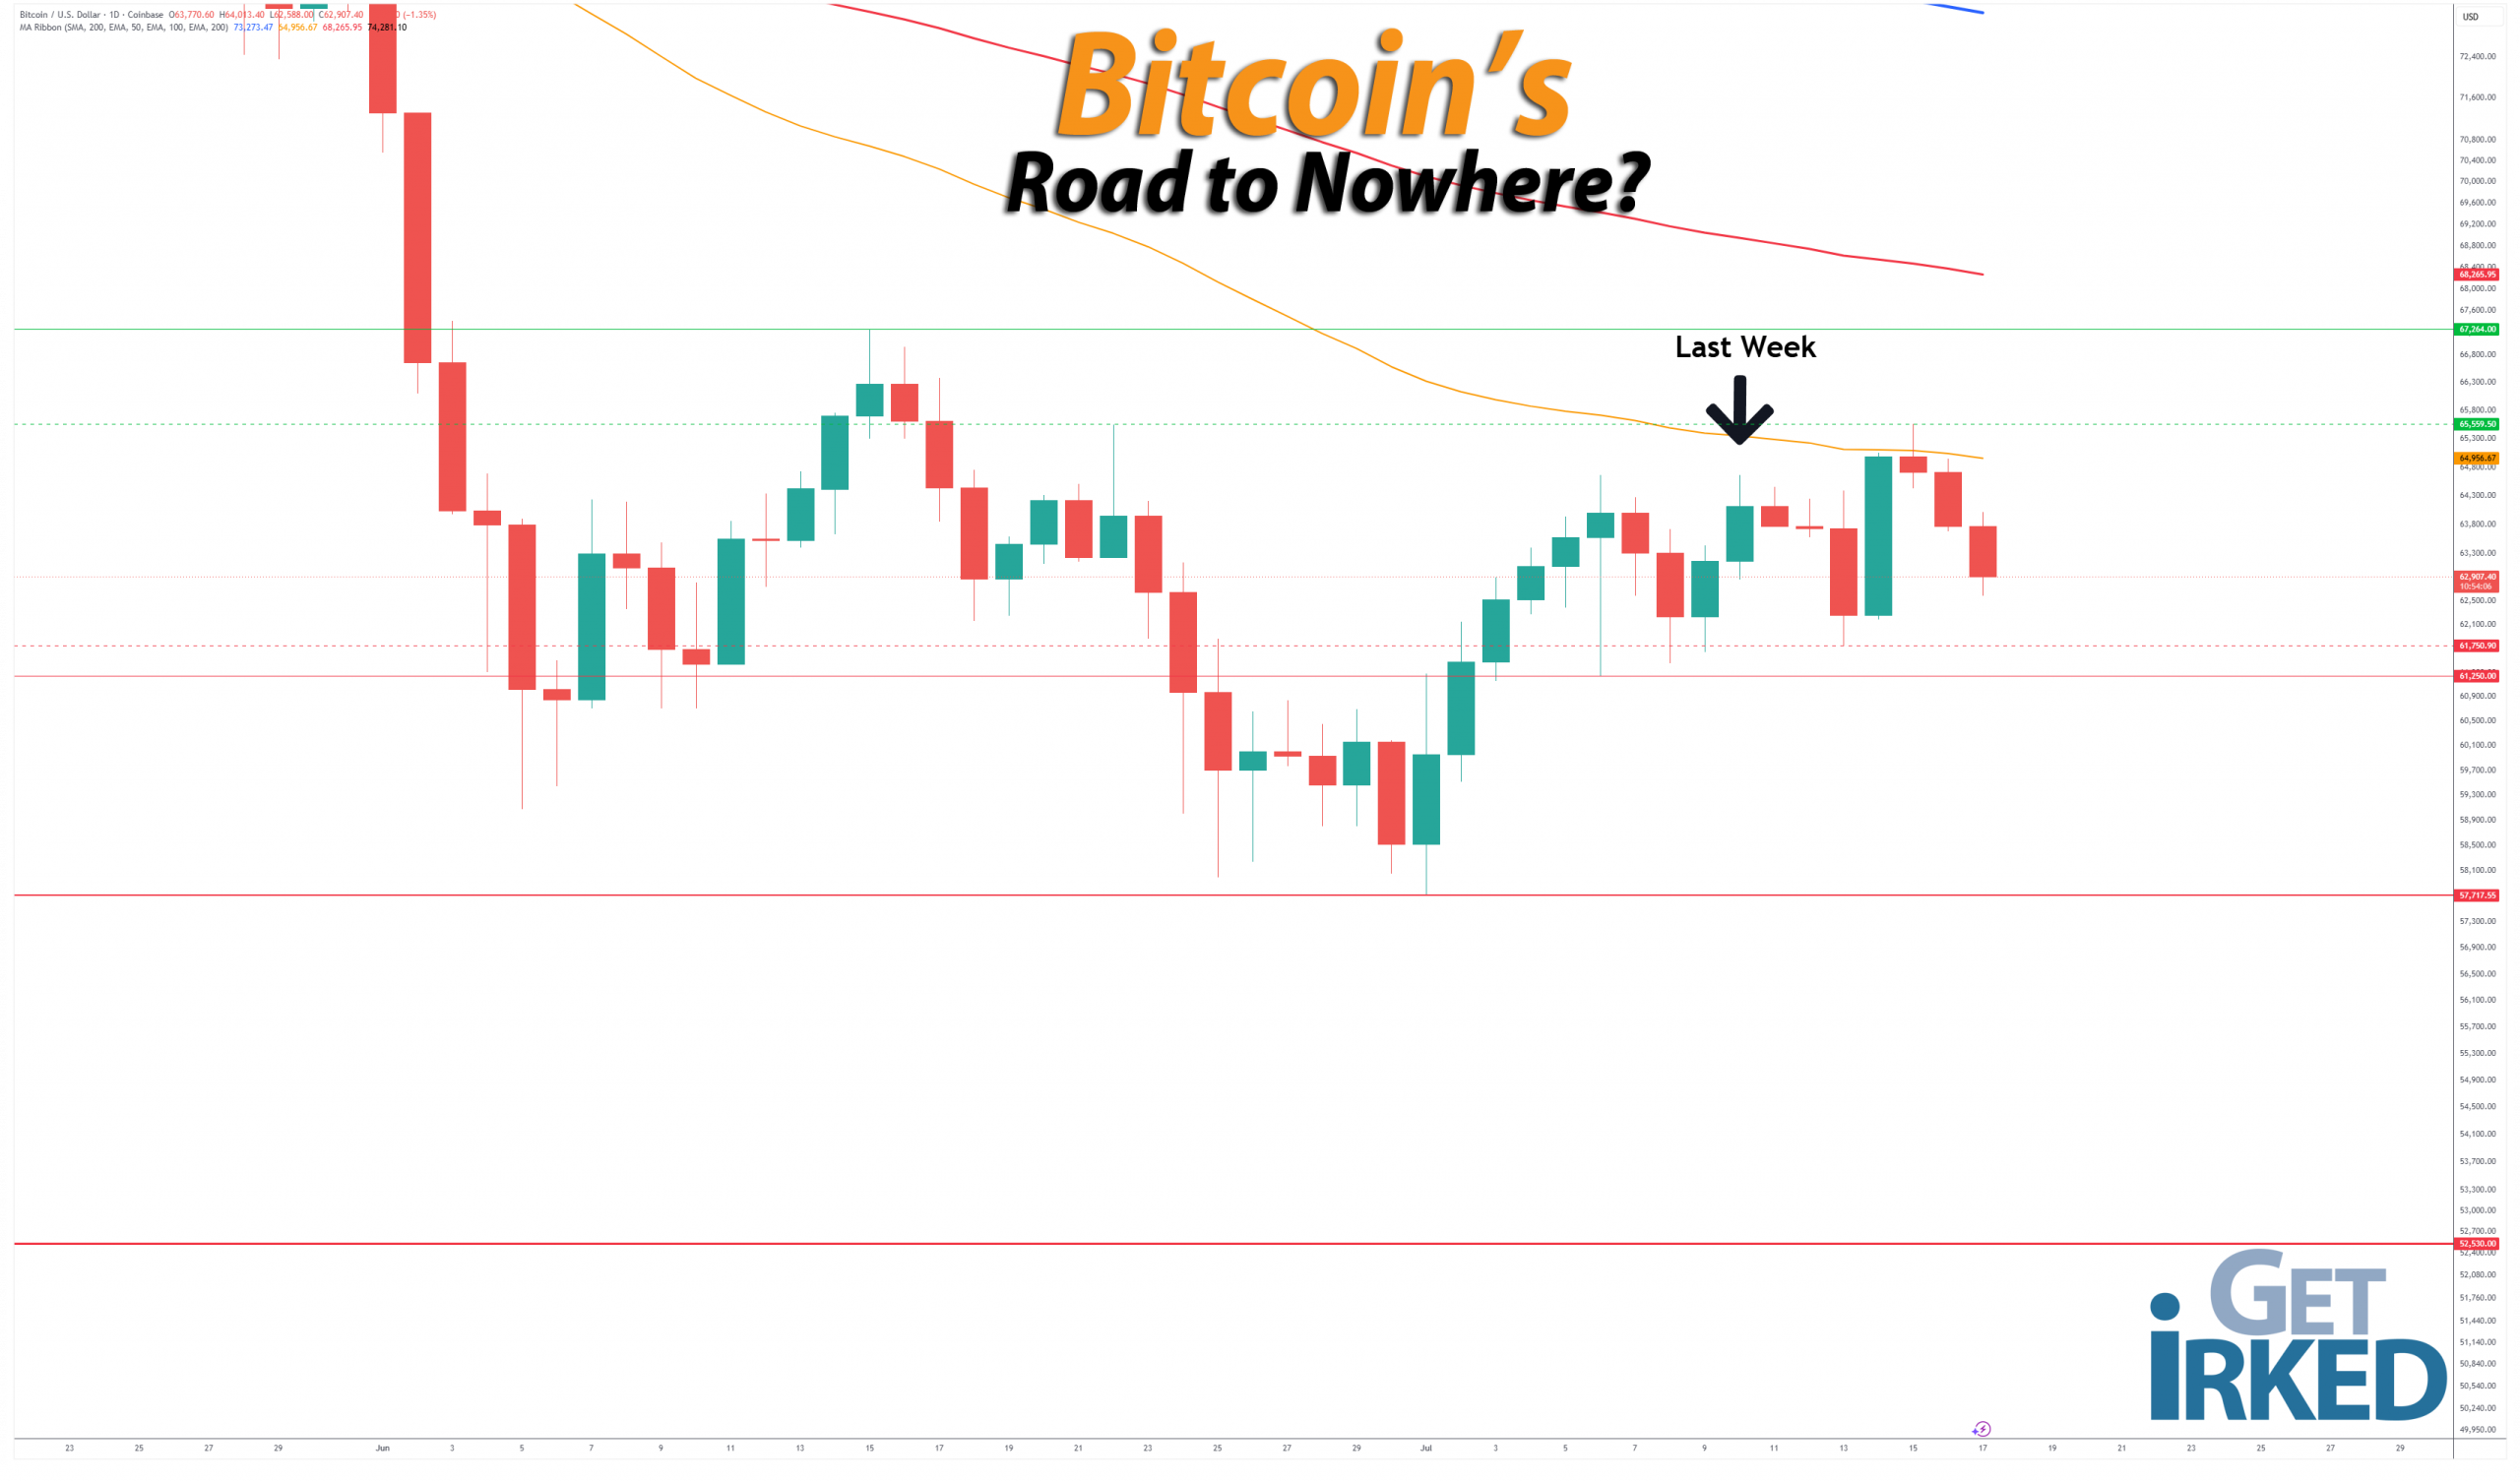
Bitcoin retreated to start the week and found support at a highly weekly low on Monday at $61,750.90. The Bulls took control and tried to break above the 50-Day Exponential Moving Average (EMA), making a new weekly high at $65,559.50 on Wednesday just barely breaking above a prior resistance point at $65,553.39. Unfortunately, that resistance level held and sent the big orange crypto recoiling downward once more on Thursday.
Why are the Bulls so bullish? What’s the Bull Case for Bitcoin having bottomed already?
Over the past weeks and months, I’ve explained why I don’t think Bitcoin has bottomed for this Crypto Winter, providing potential bottom price targets including a variety of timelines of when Bitcoin’s final breakdown could occur.
However, as an investor of nearly 30 years in markets, I also know that it’s critical to review the opposing views to your own.
This week, I went through the most popular Bitcoin bulls on X and summarized all the reasons they think Bitcoin has bottomed for this Crypto Winter and why new all-time highs are coming soon for everyone’s favorite big orange crypto.
These accounts emphasize data-driven, historical, and on-chain arguments rather than short-term hype. Here is a synthesized bullet list of their main reasons for believing the bottom is in (or very close):
-
Historical cycle patterns and 200-week MA support: Bitcoin has repeatedly bottomed near or below the 200-week moving average (~$54k–$62k zone) in prior bear markets (2015, 2018, 2022). Current price action has touched or approached this level again, historically marking the best buying opportunities before strong recoveries
-
On-chain capitulation and realized price floor: Price is near or above the realized price (~$52k–$54k), a strong historical support where losses dominate spending. Metrics like the percentage of supply in profit (~50%, very low), realized P/L ratio hitting multi-year lows (e.g., -0.35, first in 43 months), and other indicators (including MVRV and Puell Multiple among others) signal exhaustion of sellers and the start of accumulation by long-term holders.
-
Chart pattern similarity to previous cycle lows: Visual comparisons show the current setup mirroring the 2022 bottom right before the new bull market launched. Bullish divergences on weekly charts and rare “deep value” territory per models like the Power Law (only the 4th time in history, all prior instances in bear markets) add conviction.
-
Shallower drawdown and maturing market: This cycle’s ~50% correction from the ATH is significantly milder than historical 70–85%+ bears, reflecting stronger holder bases, institutional involvement, and reduced retail leverage. Many bulls view this as evidence the worst is over sooner than in past cycles.
-
Institutional/corporate accumulation and “mild bear” narrative: Entities like MicroStrategy/Strategy continue buying through dips. Saylor has described the environment as a “mild bear market” with open capital markets and ongoing accumulation, positioning it as an opportunity rather than capitulation. ETF flows and corporate treasury strategies provide structural support.
-
Extreme sentiment and crowded positioning: Widespread fear, negative funding rates, low RSI readings, and heavily short positioning are classic bottom signals. Relief bounces followed by tests align with the psychological “depression” phase before true bottoms. Crowded shorts and capitulation-like conditions often precede sharp reversals.
-
Technical and cycle timing supports: Consecutive red quarters (rare and often preceding bounces), post-halving supply dynamics, and alignment with typical bear market timelines support the view that selling pressure is exhausting. Some note potential policy tailwinds (e.g., regulatory clarity) and macro contrasts (strong traditional markets) creating relative value in BTC.
All of the above arguments are certainly legitimate and very well could be true for Bitcoin this go-round, however I find that many of the Bulls rely heavily on technical analysis and algebraically-developed indicators while forgoing historical analysis and statistics.
In my investing, I’ve found the best approach for me is to blend all of the different schools of thought available including technical analysis, the fundamentals, historical price action, and statistical review. By reviewing all of the different potentials for an investment, the blend of all available perspectives is typically closer to the actual truth than any of the individual concepts taken alone.
Accordingly, I continue to come to my conclusion that Bitcoin hasn’t bottomed, yet. The bottom could be coming very soon to a market near you, to be certain, so the above Bulls aren’t wrong in feeling we’re closer to the end of this Crypto Winter than the beginning, however their bottom targets are wrong.
In addition to all of the bullish sentiment sounding exactly like 2018 and 2022 before Bitcoin crashed an additional 20-50% from what was thought to be the cycle low, the historical precedent keeps nagging at me: Bitcoin has “only” sold off -54.50% this cycle.
Even from shallowest Crypto Winter in history, that means Bitcoin has bottomed 30% higher than the prior shallowest low. While that’s not impossible, this outcome is so statistically unlikely that the only reasonable risk-managed perspective is to assume the low is not in and that Bitcoin has an additional 12-50% to go from its current low at $57,717.55
For those keeping count, that’s a low-end bottom range from $28,858.78-$50,791.44.
If I didn’t already have exposure, I would absolutely open my position around current levels. Heck, Bitcoin’s nearly -50% from its all-time high at the time of writing! That’s a fantastic discount!
However, the potential to get much bigger discounts means I’m keeping the majority of my powder dry. If Bitcoin flips the downtrend and the bottom really is in, I can always add at higher prices once I have confirmation we won’t see lower-lows, but, for the moment, I’m just going to sit on my hands and wait to see what Bitcoin does next, regardless of what the permabulls think and say.
Bitcoin Trade Update
Premium subscribers to Get Irked get access to all the moves I've made in my Bitcoin trade over the past week as well as my next thirty (30) ... yes, 30 ... buys in Bitcoin including price levels, quantities, and a full layout of my ongoing long-term trade in the world's biggest crypto.
Not Your Keys, Not Your Crypto...
In light of brokerage failures in 2022, I no longer keep any of my crypto on an exchange and I only keep enough USD on the exchanges I use to execute my next few buys. I use multiple cold wallets from the brands Ledger and Trezor to hold my crypto (click the links to access the direct sites, and I receive no affiliate benefits from these links).
No price target is unrealistic in the cryptocurrency space – Bullish or Bearish.
While traditional stock market investors and traders may think the price targets in the cryptocurrency space are outlandish due to the incredible spread (possible moves include drops of -90% or more and gains of +1000% or more), Bitcoin has demonstrated that, more than any speculative asset, its price is capable of doing anything.
Here are some of Bitcoin's price movements over the past couple of years:
- In 2017, Bitcoin rose +2,707% from its January low of $734.64 to make an all-time high of $19,891.99 in December.
- Then, Bitcoin crashed nearly -85% from its high to a December 2018 low of $3128.89.
- In the first half of 2019, Bitcoin rallied +343% to $13,868.44.
- In December, Bitcoin crashed -54% to a low of $6430.00 in December 2019.
- In February 2020, Bitcoin rallied +64% to $10,522.51.
- In March , Bitcoin crashed nearly -63% to a low of $3858.00, mostly in 24 hours.
- Then, Bitcoin rallied +988% to a new all-time high of $41,986.37 in January 2021.
- Later in January 2021, Bitcoin dropped -32% to a low of $28,732.00.
- In February, Bitcoin rallied +103% to a new all-time high of $58,367.00.
- Later in February, Bitcoin dropped -26% to a low of $43,016.00.
- In April , Bitcoin rallied +51% to a new all-time high of $64,896.75.
- In June , Bitcoin crashed -56% to a low of $28,800.00.
- In November, Bitcoin rallied +140% to a new all-time high of $69,000.00.
- In November 2022, Bitcoin crashed -78% to a low of $15,460.00.
- In April 2023, Bitcoin rallied +101% to a high of $31,050.00.
- In June, Bitcoin dropped -20% to a low of $24,750.00
- In July, Bitcoin rallied +29% to a high of $31,862.21.
- In September, Bitcoin dropped -22% to a low of $24,900.00.
- In January 2024, Bitcoin rallied +97% to a high of $49,102.29.
- Later in January, Bitcoin dropped -22% to a low of $38,501.00.
- In March, Bitcoin rallied +92% to a new all-time high of $73,835.57.
- In August, Bitcoin dropped -33% to a low of $49,050.01.
- In January 2025, Bitcoin rallied +150% to a new all-time high of $109,358.01.
- In April, Bitcoin dropped -32% to a low of $74,420.69.
- In May, Bitcoin rallied +51% to a new all-time high of $112,000.00.
- In June, Bitcoin dropped -12% to a low of $98,247.01.
- In July, Bitcoin rallied +25% to a new all-time high of $123,231.07.
- In September, Bitcoin dropped -14% to a low of $107,250.00.
- In October, Bitcoin rallied +18% to a new all-time high of $126,296.00.
- In July 2026, Bitcoin dropped -54% to a low of $57,717.55.
Where will Bitcoin go from here? Truly, anything is possible…
What if Bitcoin’s headed to zero?
The only reason I speculate in the cryptocurrency space is I truly believe Bitcoin isn’t headed to zero.
I am prepared for that possibility, however, by knowing I could potentially lose all of the capital I’ve allocated to this speculative investment. Professional advisers recommend speculating with no more than 5% of an investor’s overall assets. Personally, I’ve allocated less than that to speculating in crypto.
I feel that anyone who doesn’t fully believe in the long-term viability of cryptocurrency would be better served not speculating in the space.
On a good day, this asset class isn’t suitable for those with weak stomachs. On volatile days, the sector can induce nausea in the most iron-willed speculator. If a speculator isn’t confident in the space, the moves will cause mistakes to be made.
DISCLAIMER: Anyone considering speculating in the crypto sector should only do so with funds they are prepared to lose completely. All interested individuals should consult a professional financial adviser to see if speculation is right for them. No Get Irked contributor is a financial professional of any kind.
Ways to give back to GetIrked:
Send me a tip via Stripe! Thank you!
Get free money by signing up for an account with my referral link for Schwab
Sign up for Gemini and we each get $10
Click this referral link to get the Brave Browser
If you use Brave, you can also use the Tip function to tip me in Basic Attention Token (BAT).
Suicide Hotline - You Are Not Alone
Studies show that economic recessions cause an increase in suicide, especially when combined with thoughts of loneliness and anxiety.
If you or someone you know are having thoughts of suicide or self-harm, please contact the National Suicide Prevention Lifeline by visiting www.suicidepreventionlifeline.org or calling 1-800-273-TALK.
The hotline is open 24 hours a day, 7 days a week.

You must be logged in to post a comment.