December 20, 2019

The Week's Biggest Winner & Loser
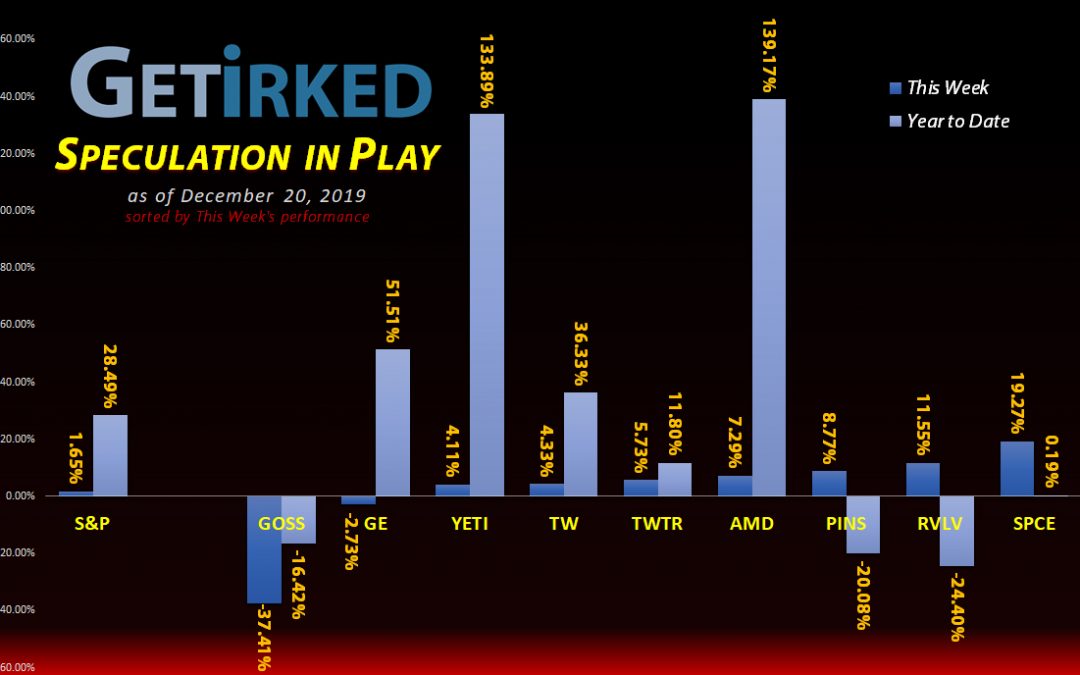
Virgin Galactic (SPCE)
From dumpster fire to rocket ship, the analyst who called out Virgin Galactic (SPCE) with the potential to triple must be feeling pretty good about themselves after SPCE gained another 20% this week, earning itself the title of this week's Biggest Winner.
Gossamer Bio (GOSS)
Gossamer Bio (GOSS) is our biggest loser this week, and it should come as no surprise because that's the reason I bought back in! The crash was due to competitor's drug news, causing GOSS to crash -37.41% this week, and definitely earning itself a spot with the Biggest Loser group.
Portfolio Allocation
Click charts for enlarged versions
Positions
%
Target Position Size

Portfolio Breakdown
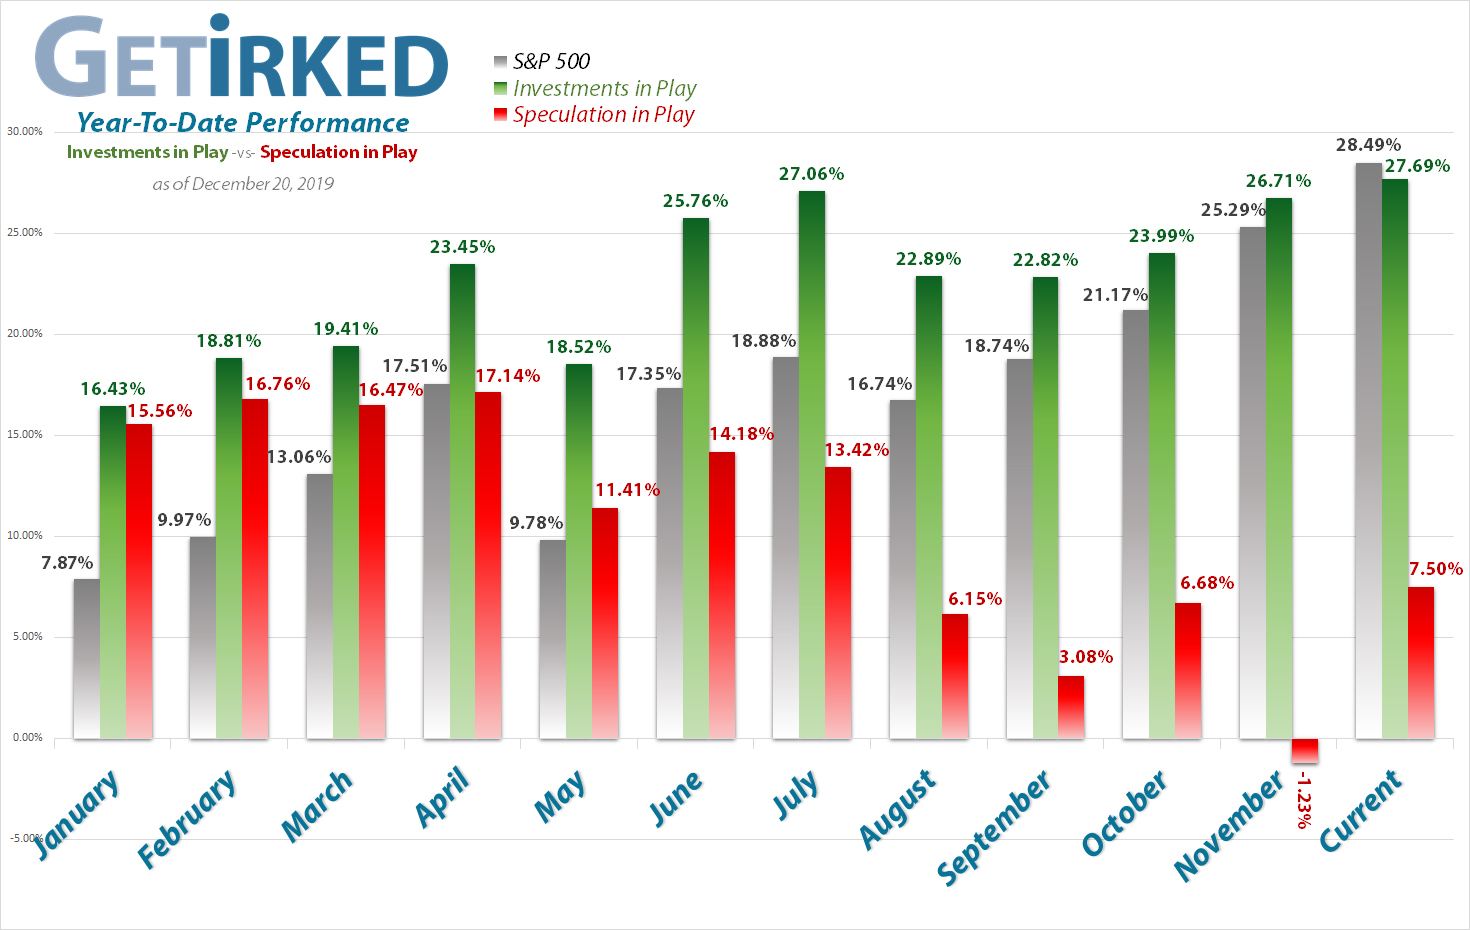
Year-to-Date Performance
Current Position Performance
Yeti (YETI)
+265.37%
1st Buy: 2/26/2019 @ $23.23
Current Per-Share: $9.50
AMD (AMD)
+206.39%*
1st Buy: 1/10/2019 @ $19.54
Current Per-Share: (-$37.04)*
Tradeweb Mkts (TW)
+32.22%
1st Buy: 4/8/2019 @ $39.22
Current Per-Share: $35.37
Virgin Galactic (SPCE)
+16.35%
1st Buy: 10/31/2019 @ $9.87
Current Per-Share: $9.26
Gossamer Bio (GOSS)
+9.47%
1st Buy: 12/17/2019 @ $14.51
Current Per-Share: $14.51
Twitter (TWTR)
+7.25%
1st Buy: 10/30/2019 @ $29.79
Current Per-Share: $29.96
General Electric (GE)
-0.42%
1st Buy: 12/19/2019 @ $11.08
Current Per-Share: $11.08
Put Spread (SPY Dec 31)
-4.63%
Cost: 12/20/2019 @ $0.70
Current Value: $0.68
Pinterest (PINS)
-12.92%
1st Buy: 5/16/2019 @ $25.72
Current Per-Share: $21.80
Revolve Group (RVLV)
-24.65%
1st Buy: 6/13/2019 @ $39.06
Current Per-Share: $25.25
* Indicates a position where the capital investment was sold.
Profit % for * positions = Current Gross Profit / Original Capital Investment
This Week’s Moves
Vertical Put Spread (SPY): Dec 31 319-308 Put
When the market gapped up on the open on Friday, I decided that it was time to put on some insurance between now and the end of the year.
I mean, c'mon, I like record highs as much as the next investor, but it feels like it's been weeks of this and the exuberance in the market is so insane with so little volatility that options are downright dirt cheap.
Just like the Vertical Put Spread I put on in Episode 47, I'm buying one put option (a bet the market is going lower) and then selling a different put option at a lower strike price in order to reduce the cost of the trade.
This time, with the SPY around $321, I bought the out-of-the-money Dec 31 319 put for $0.86. I chose an out-of-the-money put because of the morning's gap-up open. The market closed Thursday at $317.28, so the possibility of it pulling back to $319 - an amount high in the gap - is very likely as markets often "close" or "fill" gaps with future price action retreating to somewhere in the gap. When, however, is truly anyone's guess, typically, as the fill can take place anytime in the future.
To reduce the cost of the trade by -18.6%, I sold the Dec 31 308 put for $0.16 making the total cost of the trade $0.70 ($0.713 after fees and commission for options contract trading - only stock equity trading is free now...).
If the market sells off -4.5% between now and the end of the year, I stand to make the difference between the put I bought at $319 and the put I sold at $308 minus the cost of my trade: $319 - $308 = $11 - $0.70 = $10.30.
If the market sells down to just $318.30 (my strike price of $319 minus the $0.70 cost of my trade) by the end of the year, a drop of less than -1.25% as of Friday's close at $322.12, then my trade breaks even.
If the market closes the year anywhere under $318.30, I'm profitable.
Total Cost of each Put Spread: $0.70 x 100 = $70.00
Maximum Possible Profit : $319 - ($308.70) = 10.30 x 100 = $1,030.00
Maximum Possible Gain: $1,030 / $70 = 1,471.43%
The Time Decay is Very Real
I'm risking 1 to make almost 15 on this trade which sounds great, however, it's important to remember exactly how close we are to the end of the year: thanks to both Christmas Eve and New Year's Eve being half-days and no trading on Christmas, there are only 5 full trading days left before this trade becomes Cinderella's pumpkin at midnight.
If the market continues higher through the end of the year - not an uncommon occurrence - and doesn't sell off below $319 before December 31, I will lose the entire $70 per put spread in the trade.
Overall, I allocated 2.5% of my portfolio to the trade meaning that a total loss on the trade will ding my year-end performance for the entire portfolio by a fairly substantial -2.5% for the year. However, the maximum profit potential could increase my portfolio's annual gain by +36%.
Of course, the market would need to sell off nearly -5% between now and the end of the year to see the full profit, but stranger things have happened, right? Right??? 😉
Current Status
Cost of each Put Spread: $0.70
Current Value of each Spread at Friday's Close: $0.68
Profit/Loss: -4.63%
General Electric (GE): *New Position*
General Electric (GE) has shown incredible strength since I took a +27.45% gain on a trade from 12/12/2018-1/29/2019 at $8.73, but I obviously left the party way too early as it has made its way up to the $11-12 range.
GE's "new" CEO (he's now been there for more than a year) Larry Culp has demonstrated he has the chops to turn around this ailing behemoth, pulling back on the stick over the past year as GE appeared to be crash-landing with no end in sight with mountains of debt and poorly-chosen businesses.
Given how well it's held up in spite of the Boeing news (GE builds the turbines for the 737-Max, no small part of their revenue), I decided to open a position on a slight pullback on Thursday at $11.08. Since GE has sold off to levels as low as $6 (and there's still an analyst with that price target), I'm using wide spreads and small quantity buys as we head lower to ensure I don't get my face ripped off, at least not completely.
My next buy target is at $9.85 followed by lower and lower levels into the $6-7 range (and lower... yeesh).
Why open this position in my speculative portfolio? GE isn't the company it used to be, and collapsing to 1/5 of its value (from the $30s down to the $6s) is not an appropriate long-term investment for me. While I believe GE's turnaround is very real, there's also a real probability of complete collapse, and I like surer things for the long-term.
As a speculative turnaround play, however, GE fits the bill nicely.
GE closed the week at $11.03, down -0.45% from where I opened on Thursday.
Gossamer Bio (GOSS): *New Position*
Gossamer Bio (GOSS) collapsed more than -45% early this week after competitor Novartis (NVS) pulled its own asthma drug following a failed Phase 3 study, according to Investors.com.
Despite GOSS's drug, GB001, not targeting asthma, both are known as DP2 antagonists, so when NVS's drug didn't succeed, investors pulled their bets on GOSS assuming a similar catalytic mechanism will also fail. GOSS's stock price dumped from $27.15 to a low of $xx.xx in just four trading days 12/12-12/16.
This kind of volatile "fun" shows why I only speculate and never invest in bio.
Long-time readers of Get Irked will know I've played Gossamer Bio's tidal-wave tendencies since it IPO'ed earlier this year, recently closing a position I held for a little over a month from 9/26-11/1 with +39.903% in profits.
Once I read about GOSS's collapse earlier this week, I opened a very small position using trailing stops on Tuesday which gave me a start price of $14.51, where it seemed to stabilize. Naturally, it dropped lower from there, of course.
Now, it's a matter of watching price action or waiting for news, whichever comes first. If GOSS's stock performs well in trials, the price target will likely be at or above its new $27.15 all-time high, a potential gain of more than +87% from my buy level.
However, as we all know, biotechs can collapse just as quickly (if not quicker) as they rise. GOSS could easily head deep into the single digits if its trial data is poor.
Since GOSS is quite literally in uncharted territory as it makes new all-time lows, I'm using Fibonacci Retracement to pick key levels to add similar quantities in order to build a position if it continues to drop on no company-specific news. My next target price is $11.05, an additional -23.85% lower than where I started my position followed by $6.68, a drop of -39.55% from there and a drop of -53.96% from my starting price.
Why continue to add to such a stinker if it drops that low?
If GOSS drops to $6.68 (a relatively unlikely scenario), my total allocation will be about 4.19% of my speculative portfolio with a ~$9.85 per-share price representing a loss of -32.18% at the $6.68 level in the position.
However, its $9.85 share price also represents a reduction of -32.12% from my $14.51 starting price, an interesting scenario.
From there, it would be a matter of either waiting for news, determining new lower levels where to add more, or choosing to cut my losses if it dropped much further before any solid news is reported.
Important Note: If GOSS drops because of company-specific news, all bets are off - I won't be adding and will be looking at taking the loss, instead.
So, it's a wait-and-see play. Should be fun, eh?
GOSS closed the week at $15.88, up +9.47% from where I started on Tuesday.
Want Further Clarification?
As always, if you have questions about any of my positions or have positions of your own that you're curious about - feel free to leave a comment below!
You must be logged in to post a comment.