November 29, 2019

The Week's Biggest Winner & Loser
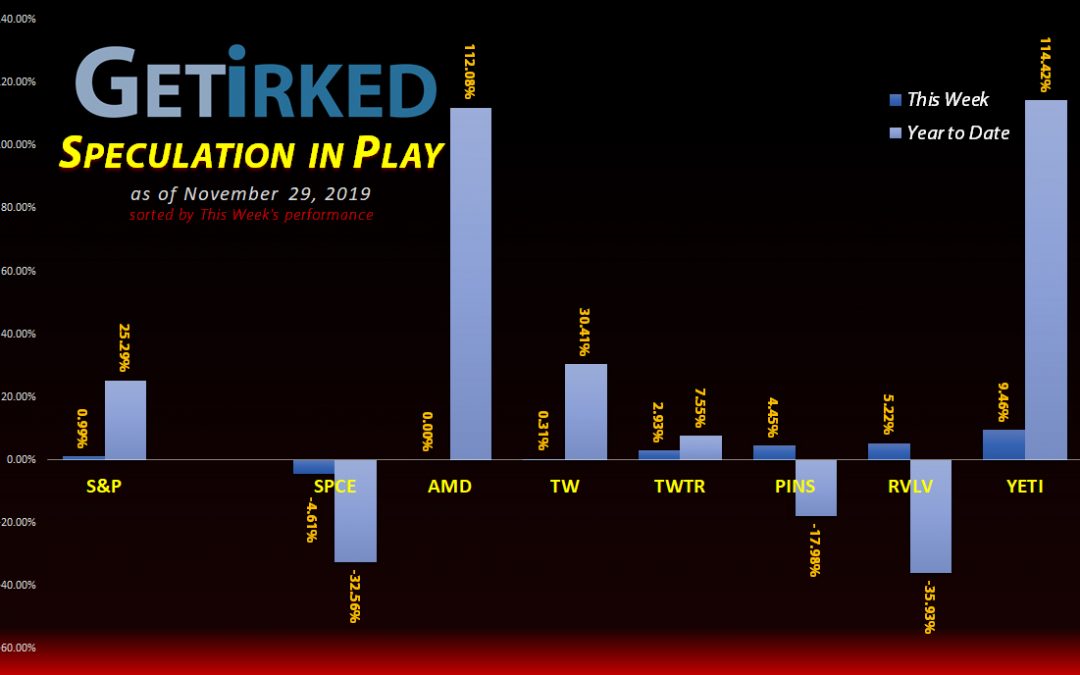
Yeti (YETI)
Good ol' Yeti (YETI), manufacturer of camping supplies, coolers, and water bottles, is nearly impenetrable with its regular reports of growth and good earnings. Yeti's +9.46% gain this week earns it the spot of Weekly Winner and almost makes me ignore the burning pile of space dung right next door to it...
Virgin Galactic (SPCE)
Maybe in space, no one can smell the hot garbage that is the raging dumpster fire of a stock, Virgin Galactic (SPCE), but down here on Earth, I can only look at "Sir" Richard Branson and ask, "What were you possibly thinking?!" Another -4.61% loss earns SPCE the weekly loser spot (again) and a -32.56% loss since its public listing in the U.S. makes me wonder if Branson got out when it listed here and is laughing at us dumb Americans.
Portfolio Allocation
Click charts for enlarged versions
Positions
%
Target Position Size

Portfolio Breakdown

Year-to-Date Performance
Current Position Performance
AMD (AMD)
+1591.14%
1st Buy: 1/10/2019 @ $19.54
Current Per-Share: $2.32
Yeti (YETI)
+103.62%
1st Buy: 2/26/2019 @ $23.23
Current Per-Share: $15.63
Tradeweb Mkts (TW)
+26.20%
1st Buy: 4/8/2019 @ $39.22
Current Per-Share: $35.45
Twitter (TWTR)
+3.76%
1st Buy: 10/30/2019 @ $29.79
Current Per-Share: $29.79
Pinterest (PINS)
-17.52%
1st Buy: 5/16/2019 @ $25.72
Current Per-Share: $23.62
Put Spread (SPY Dec 31)
-19.97%
Cost: $1.83
Current Value: $1.475
Virgin Galactic (SPCE)
-21.68%
1st Buy: 10/31/2019 @ $9.87
Current Per-Share: $9.26
Revolve Group (RVLV)
-36.14%
1st Buy: 6/13/2019 @ $39.06
Current Per-Share: $25.25
* Indicates a position where the capital investment was sold.
Profit % for * positions = Current Gross Profit / Original Capital Investment
This Week’s Moves
Insurance (SPY Options): Vertical Put Spread (Dec 31)
Over the past few weeks, I've closed out a number of positions in this portfolio to free up capital to test other speculative strategies. This week, I'm starting off with a bang - an insurance play to protect against the S&P 500 selling off between now and the end of the year.
Investors and traders buy put options when they expect an asset to lose value. In this case, I'm buying put options (or "puts") on the SPY, the Exchange-Traded Fund (ETF) that tracks the S&P 500.
On Monday, the S&P 500 popped so I opened the position by buying the December 31 SPY 313 Put Option for $4.51.
In order to break-even, I would need the S&P 500 to sell off by more than the cost of the option. However, I don't think the market is going to sell off so significantly that I need to have a naked put (this means just buying a straight put).
In order to offset some of the cost of the trade, I sold the Dec 31 SPY 307 put option for $2.68 making the cost of the trade $1.83. The combination creates what's called a vertical put spread.
While I own the higher-priced put, I'm "short" the lower-cost put. I got to collect the proceeds from the sale of the 307 put, however, I will need to "buy it back" if the SPY stays below $307 before December 31.
Now, I still need the SPY to decrease by more than the cost of the trade to make a profit, but, thanks to selling the lower-priced put, I only need SPY to drop more than $1.83 instead of more than $4.51.
In other words, the SPY needs to decrease to at least ~$311 for me to break even. At that point, any drop between $311 and $307 (the put I sold) results in profit. If the SPY drops below $307, I make no additional profit as I need to replace the 307 put option I sold.
Time-Decay Concern: If the S&P doesn't decrease below $311 between now and the end of the year, I lose the entire cost of the trade or $1.83 per contract (options are sold in quantities of 100 so each option in this trade cost me $183 at the time of the trade).
Total Cost of each Put Spread: $1.83 x 100 = $183.00
Maximum Possible Profit per Put Spread: $6.00 - $1.83 = $4.17 x 100 = $417.00
Maximum Possible Gain: $6.00 / $1.83 = 327.87%
In reviewing the price action and taking into account the overbought condition of the market, I think a pullback to $307 between now and the end of the year is very possible, while a pullback in excess of that amount is not as likely, which is why I capped my profits and reduced the cost of the trade by selling the lower-priced put.
If the market continues to rise through December, I may buy back the lower-priced put if it drops to $0.40-$0.65 and there's still some time before the end of the year. Doing this requires me to add more money to the play, however, it would also leave me with "naked puts" as an insurance play against significant selling off before the end of the year.
Again, if the SPY doesn't drop before the end of the year, I would lose the original $1.83 plus the $0.40-$0.65 I would use to close my short put.
Since putting on the trade on Monday, the market has continued to rise which causes the cost of the put I bought to lose value, but also reduces the value of the put I sold.
Current Status
Cost of each Put Spread: $1.83
Current Value of each Put Spread at Friday close: $1.475
Profit/Loss: -19.97%
Want Further Clarification?
As always, if you have questions about any of my positions or have positions of your own that you're curious about - feel free to leave a comment below!
You must be logged in to post a comment.