July 22, 2022
The Week’s Biggest Winner & Loser
Coinbase (COIN)
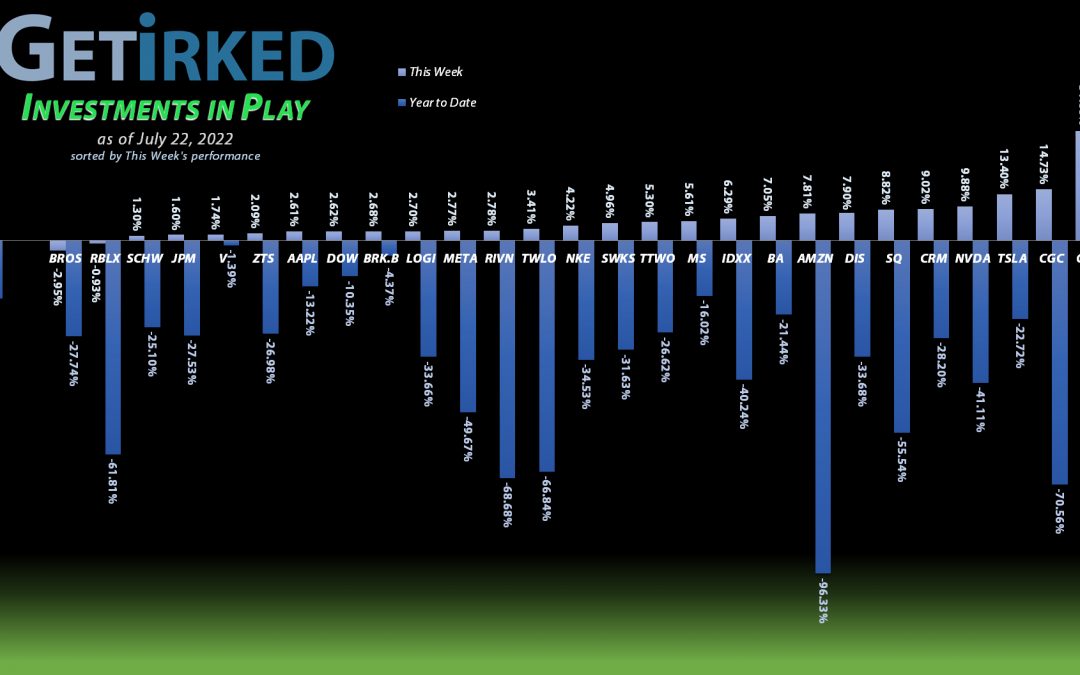
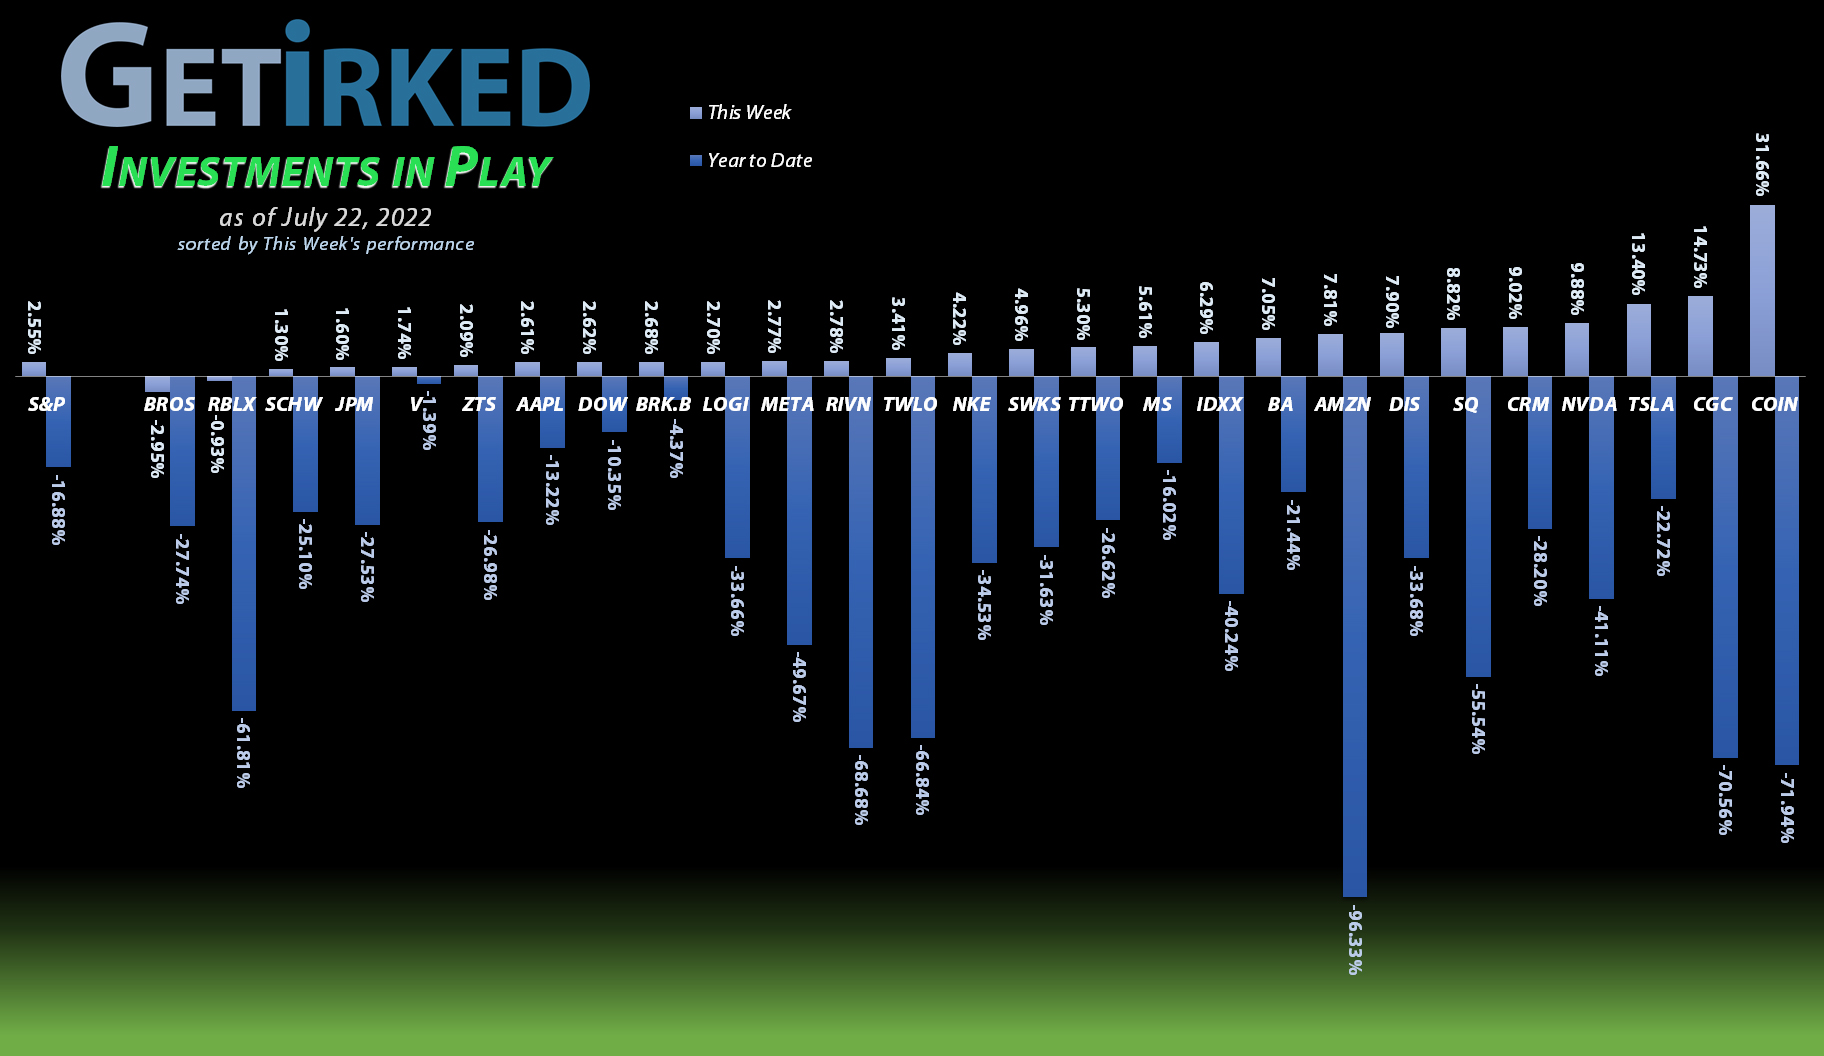
It can be truly amazing how dodging a bullet can cause such a sigh of relief that a stock will skyrocket. In this case, Coinbase (COIN) announced this week that it had no exposure to the Celsius Network or Voyager Digital, two crypto/DeFi companies that completely screwed the pooch and declared bankruptcy in the past few weeks. As a result, investors piled into COIN, causing it to, well, mint coins and surge +31.66%, earning itself the spot of the Week’s Biggest Winner.
Dutch Bros (BROS)
A rising market doesn’t necessarily lift all boats, especially when those boats have exposure to the ever-fickle consumer. Dutch Bros’ (BROS) caffeinated beverages didn’t hit the spot for investors this week as they edged out of the company for fears it might report a negative earnings report. BROS dipped -2.95% and that was enough of a drop in a green week to earn the company the spot of the Week’s Biggest Loser.
Portfolio Allocation
Positions
%
Target Position Size
The “Baskets”
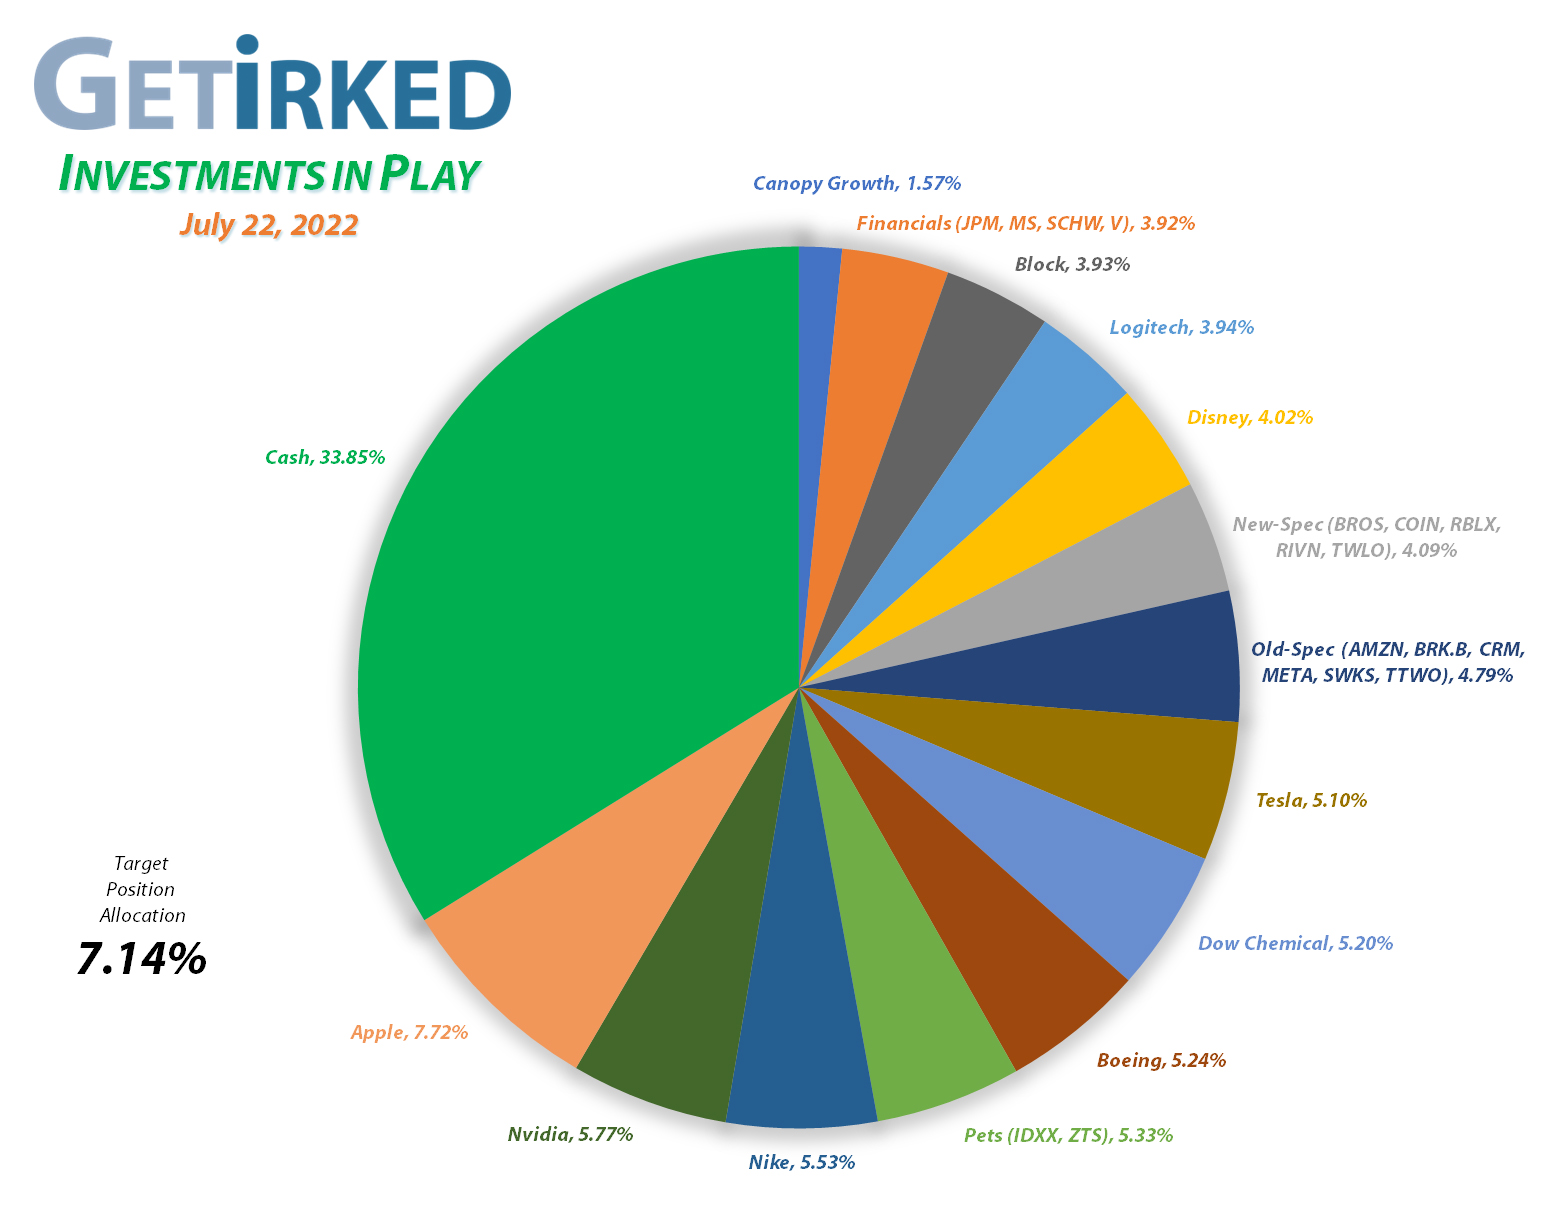
The Investments in Play portfolio contains a number of groups of stocks called “baskets.” I use baskets when I want exposure to a certain sector, but I want to use more than one stock to get that exposure without giving each individual stock an allocation.
In this portfolio, there is the Financials Basket which includes stocks that provide the portfolio with exposure to the financial sector which includes money-center banks, credit card companies, and investment management firms.
The Pets Basket includes the two leaders in pet health, long-time holding IDEXX Labs (IDXX) and newcomer Zoetis (ZTS). Both are considered “Best-in-Breed” (pun intended) for different reasons which is why I’m holding both of them instead of just picking one or over the other.
Additionally, there are two speculative baskets in the portfolio: Old-Spec and New-Spec.
Companies in the Old-Spec basket are ones with long track records where I want to have some exposure in the portfolio but I’m not confident enough to give each a full allocation.
New-Spec companies are typically stocks either new on the scene or representing a fairly new approach or sector, where, like Old-Spec, I want exposure but I don’t want a full allocation of any individual company.
Current Position Performance
Apple (AAPL)
+829.89%*
1st Buy 4/18/2013 @ $14.17
Current Per-Share: (-$35.15)*
Tesla (TSLA)
+697.96%*
1st Buy 3/12/2020 @ $111.30
Current Per-Share: (-$78.43)*
Nvidia (NVDA)
+656.12%*
1st Buy 9/6/2016 @ $15.77
Current Per-Share: (-$5.75)*
Boeing (BA)
+588.67%*
1st Buy 2/14/2012 @ $79.58
Current Per-Share: (-$148.35)*
Block (SQ)
+542.69%*
1st Buy 8/5/2016 @ $11.10
Current Per-Share: (-$71.45)*
Nike (NKE)
+419.90%*
1st Buy 2/14/2012 @ $26.71
Current Per-Share: (-$6.08)*
IDEXX Labs (IDXX)
+368.07%*
1st Buy 7/26/2017 @ $167.29
Current Per-Share: (-$39.57)*
Skyworks (SWKS)
+366.52%*
1st Buy 1/31/2020 @ $113.60
Current Per-Share: (-$33.65)*
Logitech (LOGI)
+330.87%
1st Buy 11/11/2016 @ $24.20
Current Per-Share: $12.70
Disney (DIS)
+178.13%
1st Buy 2/14/2012 @ $41.70
Current Per-Share: $36.95
Amazon (AMZN)
+106.62%
1st Buy 2/6/2018 @ $69.15
Current Per-Share: $59.25
Take Two (TTWO)
+72.50%
1st Buy 10/9/2018 @ $128.40
Current Per-Share: $75.60
Meta (META)
+72.30%*
1st Buy 9/16/2017 @ $128.58
Current Per-Share: -($64.60)*
Salesforce (CRM)
+59.02%
1st Buy 6/11/2018 @ $134.05
Current Per-Share: $114.75
Berkshire (BRK.B)
+56.35%
1st Buy 8/2/2019 @ $199.96
Current Per-Share: $182.87
Dow (DOW)
+52.34%
1st Buy 5/13/2019 @ $53.18
Current Per-Share: $33.35
JP Morgan (JPM)
+50.78%
1st Buy 10/26/2017 @ $102.30
Current Per-Share: $76.10
Zoetis (ZTS)
+13.19%
1st Buy 6/13/2022 @ $157.55
Current Per-Share: $157.55
Visa (V)
+12.28%
1st Buy 5/9/2022 @ $194.00
Current Per-Share: $190.33
Morgan Stan (MS)
+2.66%
1st Buy 4/25/2022 @ $83.50
Current Per-Share: $80.25
Dutch Bros (BROS)
-2.40%
1st Buy 9/20/2021 @ $42.25
Current Per-Share: $37.70
Roblox (RLBX)
-14.53%
1st Buy 9/29/2021 @ $77.00
Current Per-Share: $46.10
Schwab (SCHW)
-13.76%
1st Buy 4/18/2022 @ $76.30
Current Per-Share: $73.04
Twilio (TWLO)
-25.12%
1st Buy 8/8/2019 @ $125.71
Current Per-Share: $116.70
Rivian (RIVN)
-45.32%
1st Buy 11/12/2021 @ $127.00
Current Per-Share: $59.40
Canopy (CGC)
-54.35%
1st Buy 5/24/2018 @ $29.53
Current Per-Share: $5.62
Coinbase (COIN)
-66.65%
1st Buy 4/14/2021 @ $412.47
Current Per-Share: $212.34
* Indicates a position where the capital investment was sold.
Profit % for * positions = Total Profit / Starting Capital Investment
A negative share price indicates the dollar amount of profit for each share currently held.
This Week’s Moves
How do YOU define success?
When the market goes through weeks of treading water, trading within a range between buying targets and selling targets, I make a practice of looking at various statistics in my portfolio to prevent me from doing something stupid out of boredom.
Two of my favorite statistics are: (1) the percentage of my cash hoard that I’ve put to work since the beginning of the year and (2) the reduction of each of my positions’ cost bases from where I started the investment.
For instance, since the beginning of 2022, I have put 35.16% of the cash I had at the beginning of the year to work in the markets. Granted, my cash position is still more than 28% even at these levels – much higher than most financial advisers recommend – knowing that I’ve already put such a large amount of cash to work makes me feel like I didn’t miss the opportunities presented by the selloff, even if it has seen its bottom (which, mind you, most analysts don’t believe and forecast that the market will make lower lows before this bear market is through with us).
As for cost bases, I always track the current and original cost basis for each of my positions. As always, you can see those statistics in the chart of my positions above. Even when looking at the position’s biggest loser, Coinbase (COIN), I can help reduce some of the pain of being down so much by knowing I at least reduced my per-share cost -48.52% from my initial starting price of $412.47 to my current per-share cost at $212.34. Granted, I’m still down a fortune from that point, the reduction of the cost basis is a sign of success in my investing strategy of Buying in Stages, in my opinion.
How do you define success? When it comes to bear markets and down years, I think having a variety of ways to show yourself the progress you’re making will help alleviate at least some of the anxiety of seeing investments do the opposite of their intended goal as they go down in value instead of up.
Want Further Clarification?
As always, if you have questions about any of my positions or have positions of your own that you’re curious about – feel free to leave a comment below!
See you next week!
Ways to give back to GetIrked:
Send me a tip via Stripe! Thank you!
Get free money by signing up for an account with my referral link for Schwab
Sign up for Gemini and we each get $10
Click this referral link to get the Brave Browser
If you use Brave, you can also use the Tip function to tip me in Basic Attention Token (BAT).


You must be logged in to post a comment.