Summing Up The Week
What a rough couple of weeks.
The whipsaw action continues as Trump delaying tariffs gave the market a brief up day only to be pounded by an inverted yield curve, ending the week with very mixed action but all the indexes down.
Let's take a deeper dive into the news that moved the markets this week and check out my gameplan as we head further into the notorious August-September volatility period.
Market News
"Economy's Gonna Slow," says Goldman Sachs
Before the week even started, CNBC reported on Sunday that Goldman Sachs (GS) lowered its forecast for the fourth quarter from 2.0% to 1.8%, thanks to the impact of the ever-escalating Trade War. Not only does Goldman think the new round of tariffs promised by Trump will go through, its analysts also believe we won't see a trade deal for the 2020 election.
The price action of the markets on Friday definitely ended the week on a pessimistic note, however, having a news story about a slowing economy from a notable firm on Sunday virtually cemented a bad start to this week.
Hong Kong Protests Create Tensions in Market
Citizens have been protesting in Hong Kong for months, demanding everything from additional freedoms to a complete overthrow of the Chinese government for months. However, tensions accelerated on Monday after Hong Kong International Airport cancelled all flight departures for the remainder of the day, reported CNBC.
If the protests continue to escalate, the Chinese government will likely have to put the Peoples Liberation Army into action to stifle the rebellion which creates a waterfall of regulation including the inability of other governments to do business with China due to international agreement.
Confirming that the adjustments made to the Yuan last week are a result of a currency crisis, not a currency war, may cause a dramatic selloff in the markets. In other words, if China is adjusting its currency because it has to, not because it wants to, that could indicate the beginning of a global economic crisis.
The tensions and concerns drove a furious sell-off in Monday's market trading with the Dow Jones down more than 450 points at its low (nearly -2%) and the S&P 500 dropping more than -1.5% at one point.
Trump Delays Some Tariffs - Cellphones, Clothing
The markets received a brief reprieve on Tuesday when the market opened and Trump announced that he would delay putting through tariffs on cellphones and clothing, reported CNBC. Instead of being enacted on September 1 with the rest of the tariffs, these exempt items will not see tariffs until December 15.
Analysts including Jim Cramer of Mad Money believe Trump delayed the tariffs to stem some of the selloff in stocks. Moreso than any president before him, Trump tweaks policy to adjust the flow of buying and selling, as CNBC and other media have reported that Trump sees the Dow Jones Index (DJI) as a report card of how well he's performing as the President.
Yield Curve Inverts - Recession Warning?
On Wednesday morning, the yield on the 10-year Treasury Note dropped below the 2-Year Treasury's yield triggering a recession warning, reported CNBC.
The 10-year rate dropped to 1.623% while the 2-year rate was 1.634%.
Why does an inverted yield curve indicate a recession?
At its most basic level, an inverted yield curve means investors are more pessimistic over short-term growth than they are over long-term.
In other words, since treasury notes are where you invest when you're worried about the economy, a dropping 10-year yield means more investors are buying those 10-year notes as they believe the market is going to go down - not up - in the next 2 years, causing the price of the 10-year notes to increase which lowers the yield (the percentage) those notes pay out.
When investors buy the 10-year instead of the 2-year, it indicates that the market believes the 2-year outlook isn't good with many investors seeking a safe return over investing in riskier equities like stocks.
Naturally, when the news was announced the market panicked and sold off... in a big way. The Dow Jones Industrial Average (DJI) dropped 800+ points or -3.05% while the S&P 500 (SPX) dropped -2.93%.
Stocks ended up recovering slightly on Friday when the bond market cooled off, but we're still down quite a bit for the week.
Next Week's Gameplan
I'm bearish.
There. I said it.
I've donned the bear suit. I'm hunting salmon in the river. I'm using evergreen trees as back-scratchers. I'm a bear.
Why?
There are simply too many negative catalysts and no positive ones on the horizon - the U.S.-China Trade War, the inverted yield curve, the Hong Kong protests, the weakening European economy, the upcoming 2020 Presidential Election... heck, no one's even talking about Brexit, anymore, so that could smack us around, too!
That's a lot of bad news!
Add to the smorgasbord of negative news the facts that the S&P 500 is near record highs and the U.S. stock market seems to be ignoring the warning signs flashing in the rest of the world, and you've got the recipe for a potentially major market pullback.
In fact, some analysts are predicting that not only will we see the market test the lows from last December - they expect to see even lower lows than Christmas Eve 2018.
Taking all of these horror stories into account, I've adjusted my Stock Shopping List.
In addition to lowering some of my buying targets on each of my Investments in Play, I've also lowered the quantity I intend to buy at those next levels.
I've created a "Doomsday Scenario" Trading Plan to account for the market's newfound volatility combined with seriously negative analyst predictions.
How do you plan for a Doomsday Scenario?
In order to calculate price levels for a possible worst-case scenario, I've researched the most dramatic pullbacks last seen in the 2008-2009 Financial Crisis for each individual name in my long-term portfolio to come up with the absolute worst-case scenario price (aside from a total stock market collapse - which would indicate the end of the world, something slightly more serious than what's going on with our investments).
Here are some example price drops some high-quality stocks experienced from their highs to the generational bottom in 2008-2009:
Nike (NKE) dropped more than -25%
Disney (DIS) pulled back more than -35%
Apple (AAPL) dropped over -60%
Bank stocks like JP Morgan (JPM) pulled back more than -70% from their highs
Nvidia (NVDA) pulled back more than -85% (sounds familiar if you look at last year, right?)
It's important to remember that these levels are the worst-case targets in my plan. We likely won't see pullbacks to that extent.
In order to prepare for any scenario, I also have buy targets at key levels on the way down to those worst-case targets. I do want to make sure I have funds in case stocks get hit as hard (or harder) as they did 10 years ago.
Why not go completely to cash?
When the market feels this bearish, it can be tempting to sell everything, lock in profits, and go completely to cash.
Why not to do this? Well, at its most basic level, the market is unpredictable.
In a perfect world, we'd know for certain when the market is at its peak, go completely to cash, and wait for the pullback to buy everything back at their lowest levels.
But, here's the rub: we don't know if and when a sell-off is going to happen.
If we do see a dramatic sell-off in the markets, we don't know how bad it will get. We don't know how long it will last. We also won't know when the market has bottomed and it's time to get back in.
You can't time the markets.
Trying to time the market is one of the biggest mistakes made by both traders and investors - they get out at the wrong time and get in at the wrong time, losing money on both ends of a selloff.
This is why I take the approach to Sell in Stages on the way up and Buy in Stages on the way down. I almost never get the best prices in either direction, however, I lower my per-share basis on the way up which frees capital to buy on the way down. For my long-term holdings, I always have a position, so even if the market continues higher, I'm still exposed to some of the upside while also protecting against epic drops.
If we see pullbacks like those of 2008-2009, it may be frightening. However, a cataclysmic market drop is also an amazing buying opportunity where investors may see long-term returns of epic proportions as the market returns to previous levels. However, in order to be able to buy, you've got to have cash on the sidelines to put to work.
Long-term investing is about balance and moderation - try to create a plan to prepare for all possible scenarios.
At this point, the market's no longer in selling season (it's not time to take profits if you haven't already) as it appears to want to roll over just like it did in the fourth quarter of 2018. We're headed into buying season. Selling now is really only advisable if you have no cash or have funds you may need in the next five years (seriously, that's what actual financial advisers suggest - plan for five years of downturn during bad market selloffs).
As we head into a period of even greater market volatility, create a plan to prevent yourself from feeling too much FOMO and fear (e.g. don't look at your portfolio too often if it fills you with dread).
And remember: don't panic. This, too, shall pass.
This Week in Play
Stay tuned for this week's episodes of Investments in Play and Trades in Play coming online later this weekend!
Crytpo Corner
Important Disclaimer
Get Irked contributors are not professional advisers. Discussions of positions should not be taken as recommendations to buy or sell. All investments carry risk and all readers must accept their own risks. Get Irked recommends anyone interested in investing or trading any asset class consult with a professional investment adviser to determine if an investment idea is suitable to them and their investment goals.
Bitcoin Price (in USD)
%
Weekly Change
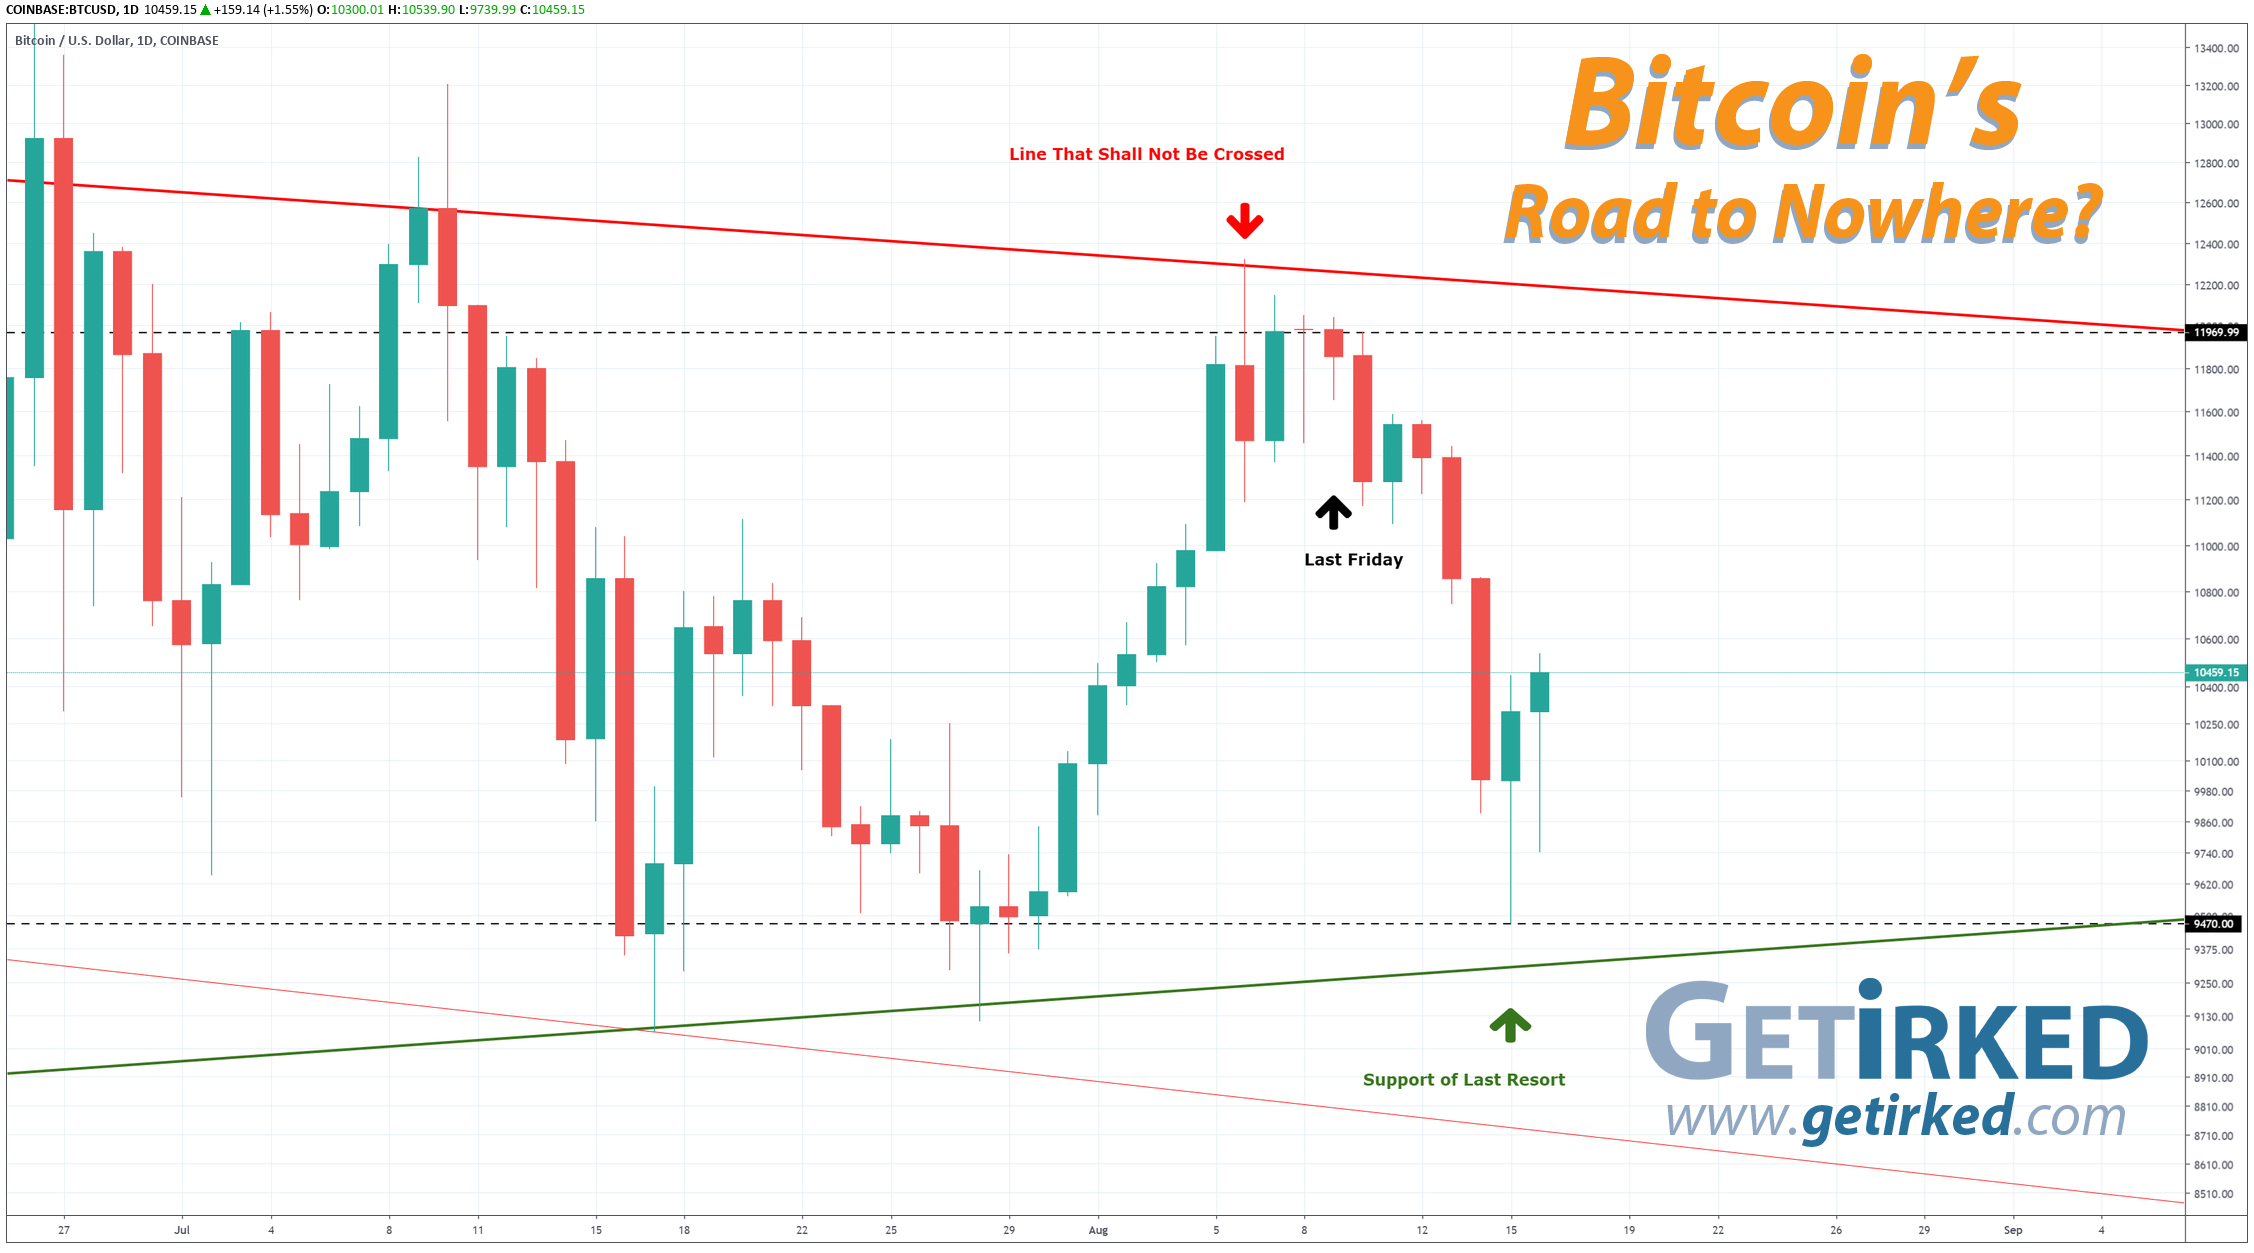
Bitcoin Price Action
Analysts believe that Bitcoin has developed a correlation with the stock market and gold. Typically, when the stock market sells off, gold rises in value and these analysts think the same thing may be happening in Bitcoin (although not in the other cryptocurrencies).
Ummmm... not so much.
Remember how I said last week, "I'm betting we haven't seen the end of stomach-flipping drops?" Yeah, well, Bitcoin started selling off shortly after last week's Week in Review, took a break on Sunday to respect the Sabbath as it's prone to do, and then went back at it, pounding investors for four days in a row with drop after painful drop.
Heck, it dropped nearly -8% in a single day combining for a total loss of nearly -21% from its weekly high of $11,969.99 on Saturday to its weekly low of $9,470.00 on Wednesday.
In case you're not paying attention, this means there is absolutely no correlation between Bitcoin and gold. In fact, there's no consistent correlation between Bitcoin and any other asset class. Any correlation between Bitcoin and the S&P 500, gold, or other asset class is fleeting, at best, as Bitcoin typically separates itself from other classes as quickly as it comes together with them.
Bitcoin is a currency developed by a computer and traded by computers. It will dance to its own drum and confound any analyst seeking to apply traditional Technical Analysis to the sector. For example, Goldman Sachs predicted a $14,000 price target and recommended investors buy Bitcoin... right before it dropped.
Bitcoin did recover nicely from its new higher low of $9,470.00 on Thursday. Is this the start of another run at new highs or are the bears just building up strength for another push to lower lows?
Bitcoin Gameplan
Just like any asset, Bitcoin's value ebbs and flows. However, unlike most asset classes, the volatility and extent to Bitcoin's value adjustments are often extreme - as seen this week.
As I said last week, I only like entering Bitcoin when it becomes oversold, so I patiently waited after Bitcoin made another try for a new higher-high, briefly touching $11,969.99 shortly after I posted last week's Week in Review.
From there, it was just a matter of waiting as Bitcoin crashed and crashed. And crashed. And crashed some more.
As Bitcoin approached the $10,000 mark, the 4H Relative Strength Indicator (RSI) had become oversold to a crazy extent, so I opened a position with 1% of my total desired trade allocation at $10,137 and then another 1% when Bitcoin crossed $9,727.33.
Yes, I only put in 1% of my allocation when I first open a position with Bitcoin. Since I don't know what kind of a drop we're in, I buy in stages at wide scales, entering larger quantity orders as the sell-off increases.
Why do I use such a small amount to start?
After living through Bitcoin vomiting up -50% of its value in less than 30 days (it dropped -35% in less than a week) back in November-to-December of 2018, I don't take the possibility lightly of Bitcoin destroying value faster than you can say "Get me a bucket to hold my vomiting losses!"
By using small quantities at first, I'm able to save my capital in case we see an unusually huge sell-off where I can stock up at much lower prices. Plus, I get the added benefit of not feeling powerful emotions if Bitcoin takes a death elevator lower since I only have a small amount in play.
What ended up happening this time?
Bitcoin made its weekly low at $9,470.00 before bouncing to $10,445.00 on Thursday, where I took a small part of my position off when I was up +5%.
Why sell any part of the position so soon?
Bitcoin is doing its "Money Vacuum" thing.
Bitcoin almost never reverses trend immediately after a huge selloff. Typically, it hits extreme oversold conditions and sees a Dead Cat Bounce where it springs up as much as 10-15% where it vacuums in money from buyers who are acting out of FOMO at the concept of potentially missing the next moon.
After pulling in those buyers' extra cash, Bitcoin then heads back down with gusto for another attempt at breaking through its most recent low, causing the new buyers to sell as their overly-tight stop-loss orders trigger on the way down. This only accelerates the selloff further (and is part of the reason Coinbase no longer allows naked stop-loss orders; speculators have to set a limit price so the market has some modicum of control during a selloff).
During an uptrend Bull Market, the low typically holds and Bitcoin finally reverses trend at that point. Bitcoin did this when it last sold off just a few weeks ago on July 27-30. It tested the $9,100-$9,300 level repeatedly over 3-4 days, and then headed back up for another try at a new high before meeting resistance at $12,000.
However, there are the rare times, like in November 2018, when the low gives way and the situation becomes "Look out below!" as Bitcoin ignores all oversold indicators and heads south for the winter, selling off as much as 50% to 80%.
That's right - during truly epic selloffs, the Relative Strength Indicator (RSI) bears no weight on Bitcoin's price movements. Bitcoin often becomes more oversold according to its RSI than any other asset class.
If I'm wrong when I take small profits and Bitcoin doesn't retest its lows before heading higher, that's fine by me. I've still got the majority of my position intact, however, now what I have left is at a lower per-coin cost than when I started. I'm happy taking whatever profits I can with whatever position Bitcoin is willing to give me.
If Bitcoin retreats to retest its lows like it did in July (or make new ones in December 2018), I can use the profits I took to add in stages as Bitcoin goes "on sale," further lowering my per-coin cost.
What's next in the trade?
Bitcoin's volatility is definitely back in a big way. There's no way to tell whether Thursday's bounce off $9,470 is an indicator that it's headed back to test its highs or if the bears are just building up strength to really push it down.
As always, my trading plan takes both possibilities into account with orders to add more if we see BTC try to fall through its July low of $9,071.00 or take profits if it makes an attempt to break above its June high of $13,868.44.
Keep your head down, it's a wild ride.
DISCLAIMER: Anyone considering speculating in the crypto sector should only do so with funds they are prepared to lose completely. All interested individuals should consult a professional financial adviser to see if speculation is right for them. No Get Irked contributor is a financial professional of any kind.
Get Irked in your Email?
We're making a list and checking it twice! If there's enough interest, we'll start sending the Week in Review straight to your inbox!
You must be logged in to post a comment.