October 16, 2020

Click above image for larger version
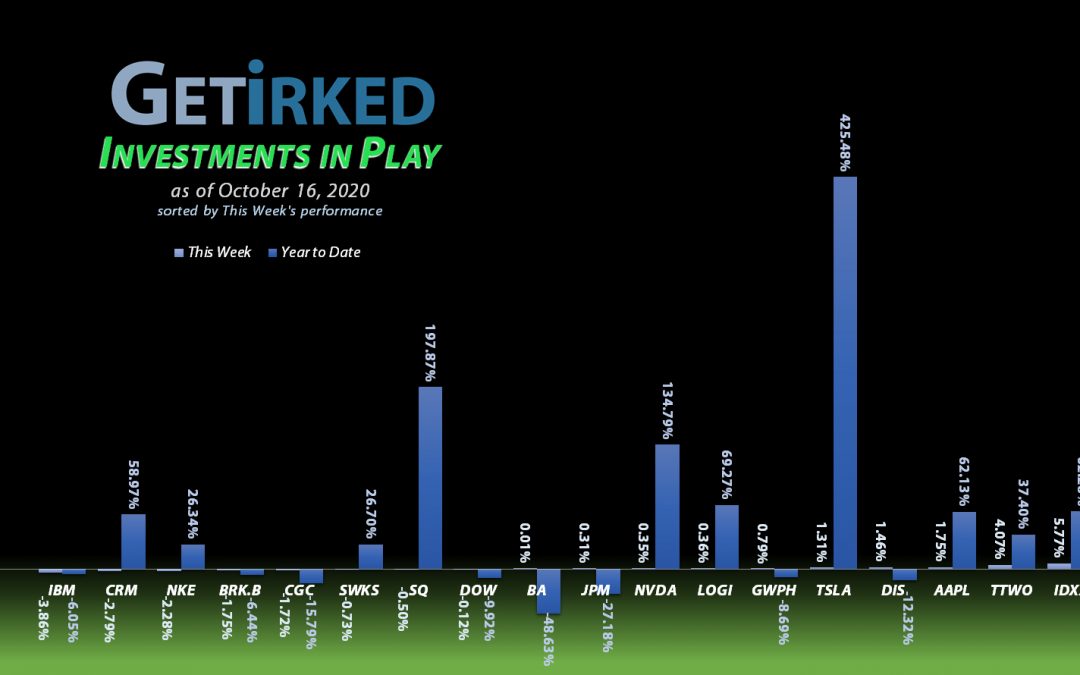
The Week's Biggest Winner & Loser
Twilio (TWLO)
Twilio (TWLO) remains the cloud darling as the stay-at-home economy becomes more solidified. TWLO provides the back-end consumer-facing cloud apps need, and analysts upgrades continue pushing the stock higher, jumping +6.61% in an otherwise dead week to earn the spot of the week's Biggest Winner.
IBM (IBM)
The excitement over IBM's (IBM) announcement last week that it would be spinning off its cloud division from its legacy products division seemed to wane this week as IBM pulled back -3.86% to earn the week's Biggest Loser spot.
Portfolio Allocation
Click charts for enlarged versions
Positions
%
Target Position Size

Click above image for larger version
Portfolio Breakdown

Click above image for larger version
Year-to-Date Performance
Current Position Performance
Square (SQ)
+869.53%*
1st Buy 8/5/2016 @ $11.10
Current Per-Share: (-$114.40)*
Disney (DIS)
+706.48%
1st Buy 2/14/2012 @ $41.70
Current Per-Share: $17.95
Apple (AAPL)
+673.26%*
1st Buy 4/18/2013 @ $14.17
Current Per-Share: (-$62.40)*
Boeing (BA)
+623.50%*
1st Buy 2/14/2012 @ $79.58
Current Per-Share: (-$372.32)*
Nvidia (NVDA)
+521.95%*
1st Buy 9/6/2016 @ $63.10
Current Per-Share: (-$102.82)*
Take Two (TTWO)
+538.82%
1st Buy 10/9/2018 @ $128.40
Current Per-Share: $31.22
Nike (NKE)
+486.22%*
1st Buy 2/14/2012 @ $26.71
Current Per-Share: (-$29.94)*
IDEXX Labs (IDXX)
+443.34%
1st Buy 7/26/2017 @ $167.29
Current Per-Share: $77.99
Twilio (TWLO)
+281.75%*
1st Buy 8/8/2019 @ $125.71
Current Per-Share: (-$16.25)*
Tesla (TSLA)
+243.41%*
1st Buy 3/12/2020 @ $111.30
Current Per-Share: (-$11.86)*
Salesforce (CRM)
+232.54%
1st Buy 6/11/2018 @ $134.05
Current Per-Share: $79.91
Logitech (LOGI)
+217.42%
1st Buy 11/11/2016 @ $24.20
Current Per-Share: $25.15
Skyworks (SWKS)
+82.94%
1st Buy 1/31/2020 @ $113.60
Current Per-Share: $84.00
IBM (IBM)
+75.84%
1st Buy 11/6/2018 @ $120.87
Current Per-Share: $71.62
Berkshire (BRK.B)
+49.00%
1st Buy 8/2/2019 @ $199.96
Current Per-Share: $142.22
Dow (DOW)
+29.01%
1st Buy 5/13/2019 @ $53.18
Current Per-Share: $38.21
Canopy (CGC)
+21.23%
1st Buy 5/24/2018 @ $29.53
Current Per-Share: $14.65
JP Morgan (JPM)
+13.98%
1st Buy 10/26/2017 @ $102.30
Current Per-Share: $89.06
GW Pharm (GWPH)
-4.59%
1st Buy 7/25/2018 @ $142.28
Current Per-Share: $100.00
* Indicates a position where the capital investment was sold.
Profit % for * positions = Total Profit / Original Capital Investment
A negative share price indicates the dollar amount of profit for each share currently held.
This Week's Moves
No Moves This Week: Planning for Future Volatility
With the 2020 presidential election mere weeks away, we can expect significant volatility in the stock market in the coming days and weeks. Accordingly, I'm making plans for both up days and down days.
In September, the S&P 500 sold off a little more than 10% in a garden-variety correction, so I'm using the levels where my Investments in Play portfolio found support as initial buying targets. You can see my current buying price targets for all three of my portfolios - Investments in Play, Speculation in Play, and the Pandemic Portfolio - on the Stock Shopping List which I update nearly daily.
As always, I Buy in Stages which means my next buy is never my last buy in a stock; I always leave cash on the sidelines in case we see a more extreme selloff.
Some analysts suggest the market is due for a generational 90-year selloff, arguing that the -35% drop we saw in March 2020 wasn't significant enough to qualify. These analysts refer to data stretching back into the 17th century where an historic selloff of 50-75% occurs every 90 years.
When was the last generational selloff? 1929. Add 90 years and you get a target date of, you guessed it, right about now.
That being said, my approach to long-term investing has always been one of moderation. If you subscribe to the 90-year selloff theory, sell all of your stocks, and the market skyrockets from here, when do you get back in? Do you ever trust the market again?
For me, I like to play both sides and have plans for when the market goes up and when the market goes down. Sure, I'm not avoiding all of the downside risk with this strategy, but I'm also not missing out on all of the upside.
Want Further Clarification?
As always, if you have questions about any of my positions or have positions of your own that you're curious about - feel free to leave a comment below!
![]()
Get Irked is a small community made up of helpful, friendly and motivated investors and traders of all levels looking to reach the same goal - the ability to invest profitably in order to achieve financial independence.
Investors of ALL experience levels are welcome.
Join Get Irked by clicking here!
Disclaimer: Eric "Irk" Jacobson and all other Get Irked contributors are not investment or financial advisers. All strategies, trading ideas, and other information presented comes from non-professional, amateur investors and traders sharing techniques and ideas for general information purposes.
As always, all individuals should consult their financial advisers to determine if an investing idea is right for them. All investing comes with levels of risk with some ideas and strategies carrying more risk than others.
As an individual investor, you are accountable for assessing all risk to determine if the strategy or idea fits with your investment style. All information on Get Irked is presented for educational and informational purposes only.
You must be logged in to post a comment.