Risk Disclaimer
No one at Get Irked is a professional financial adviser. All information provided on this website is for entertainment and educational purposes only. All investments involve risk, all equities could lose value, and investors are responsible for their own choices. Consult with your own financial adviser to see if any of these positions and strategies fit your risk profile and long-term financial goals.
Pandemic Portfolio: Update #37
This is an update to a series. See Starting a Portfolio from Scratch to learn how it started.
A rally for all but the Pandemic Portfolio
The first month of the new year saw the S&P 500 and almost all sectors across the board rally for nearly the entire month... except for a lot of the positions in this portfolio.
When even the benchmark index is up more than 4% Year-To-Date, it's surprising to me that almost every position in this portfolio dramatically underperformed. It just goes to show how investors tastes are fickle with consumer staples and healthcare (represented in this portfolio by Pepsico (PEP) and UnitedHealth (UNH)) are no longer the favorites they were last year.
Let's take a look at the moves that happened since the last update...
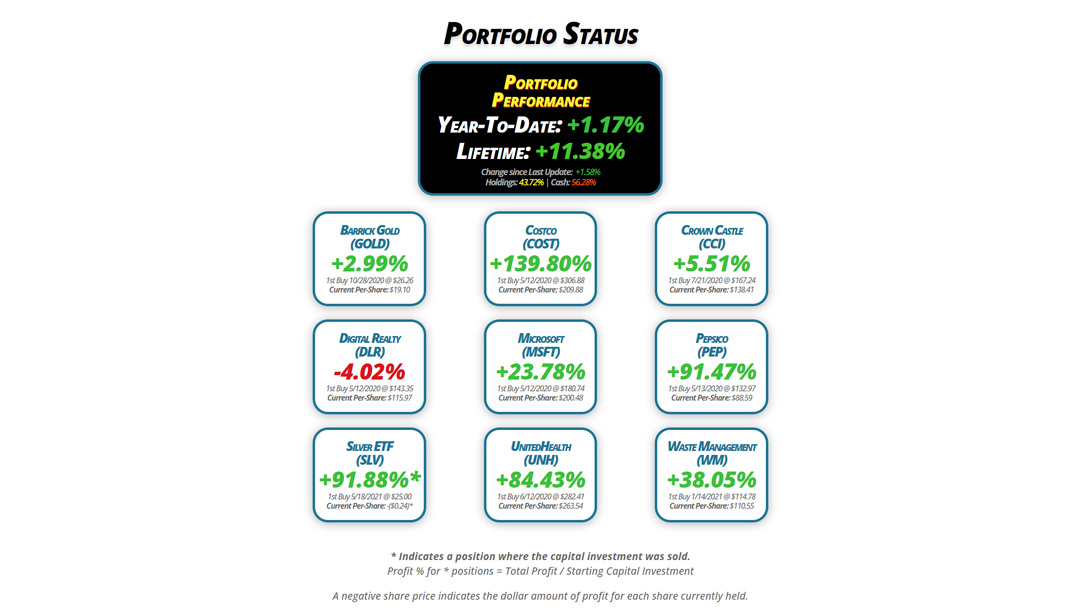
Portfolio Status
Portfolio
Performance
Year-To-Date: +1.17%
Lifetime: +11.38%
Change since Last Update: +1.58%
Holdings: 43.72% | Cash: 56.28%
Barrick Gold
(GOLD)
+2.99%
1st Buy 10/28/2020 @ $26.26
Current Per-Share: $19.10
Digital Realty
(DLR)
-4.02%
1st Buy 5/12/2020 @ $143.35
Current Per-Share: $115.97
Silver ETF
(SLV)
+91.88%*
1st Buy 5/18/2021 @ $25.00
Current Per-Share: -($0.24)*
Costco
(COST)
+139.80%
1st Buy 5/12/2020 @ $306.88
Current Per-Share: $209.88
Microsoft
(MSFT)
+23.78%
1st Buy 5/12/2020 @ $180.74
Current Per-Share: $200.48
UnitedHealth
(UNH)
+84.43%
1st Buy 6/12/2020 @ $282.41
Current Per-Share: $263.54
Crown Castle
(CCI)
+5.51%
1st Buy 7/21/2020 @ $167.24
Current Per-Share: $138.41
Pepsico
(PEP)
+91.47%
1st Buy 5/13/2020 @ $132.97
Current Per-Share: $88.59
Waste Management
(WM)
+38.05%
1st Buy 1/14/2021 @ $114.78
Current Per-Share: $110.55
* Indicates a position where the capital investment was sold.
Profit % for * positions = Total Profit / Starting Capital Investment
A negative share price indicates the dollar amount of profit for each share currently held.
Portfolio Breakdown

Click image for an enlarged version.

Click image for an enlarged version.
Positions*
%
Target Position Size
* The iShares Silver ETF (SLV) is not its own position, so there is one less in allocation size

Click image for an enlarged version.
Moves Since Last Update
Barrick Gold (GOLD): Profit-Taking
Current Price: $19.67
Per-Share Cost: $19.10 (-0.261% since last update)
Profit/Loss: +2.99%
Allocation: 7.506%* (+0.235% since last update)
Next Buy Target: $15.16
The precious yellow metal has exploded off 2022's lows in a big way, carrying all of the miner stocks with it. On Friday, January 13, Barrick Gold (GOLD) triggered my next sell order which filled at $19.71, locking in +24.83% in gains selling the shares I bought for $15.79 back on July 14, 2022.
It might seem strange to take profits that only lowered my per-share cost -0.261% from $19.15 to $19.10, however Barrick fell much further than I anticipated during gold's selloff last year, bottoming at $13.01. That means in the past two months, GOLD has rallied an epic +51.50% off that low, and that fact alone motivated me to lock in some gains.
From here, my next sell target is $21.07, below a past point of resistance, and my next buy target is $15.16, slightly above a key level of support.
GOLD is $19.67 as of this update, down -0.21% from where I took profits.
Costco (COST): Strategy Update
Current Price: $503.29
Per-Share Cost: $209.88 (Unchanged since last update)
Profit/Loss: +139.80%
Allocation: 4.726%* (+0.378% since last update)
Next Buy Target: $449.89
Costco (COST) actually performed well throughout the month and rallied pretty substantially off of its December lows. This leaves my gameplan unchanged with my next buy target at $449.89, just above COST's December lows.
I remain confident in this position so I have no plans to take additional profits until COST breaks to new all-time highs.
Crown Castle (CCI): Dividend Reinvestment
Current Price: $146.04
Per-Share Cost: $138.41 (-1.129% since last update)
Profit/Loss: +5.51%
Allocation: 6.665%* (+0.455% since last update)
Next Buy Target: $122.13
Crown Castle (CCI) paid out its quarterly dividend on Tuesday, January 3, which, after reinvesting, lowered my per-share cost -1.129% from $139.99 down to $138.41.
From here, my next buy price target is $122.13, just above CCI's 2022 low. My next sell target for CCI is $162.80, slightly below its 200-Day Moving Average in case it decides to make a run higher.
Digital Realty Trust (DLR): Dividend Reinvestment
Current Price: $111.31
Per-Share Cost: $115.97 (-1.134% since last update)
Profit/Loss: -4.02%
Allocation: 7.722%* (+0.749% since last update)
Next Buy Target: $86.07
Digital Realty Trust (DLR) paid out its quarterly dividend on Tuesday, January 17, which, after reinvesting, lowered my per-share cost -1.134% from $117.30 down to $115.97.
From here, my next buy target is $86.07, above DLR's 2022 lows, and my next sell target is $116.25, slightly above the high of DLR's last rally and below the next point of resistance.
Microsoft (MSFT): Strategy Update
Current Price: $248.15
Per-Share Cost: $200.48 (Unchanged since last update)
Profit/Loss: +23.78%
Allocation: 4.703%* (+0.093% since last update)
Next Buy Target: $197.98
Microsoft (MSFT) has had a wishy-wash time of it lately, breaking down early in January before rallying into earnings. Mr. Softy did report a blowout quarter for Q4 of 2022 but went on to provide soft guidance for 2023 which caused the stock to plateau around the $240.00.
Since my current cost basis of $200.48 is still higher than where I initally opened the position at $180.74, my next buy target remains below my cost basis at $197.98, the next key level of support.
I also have plans to reduce my position further should MSFT decide to make a run for $300 with a sell target at $293.83.
Pepsico (PEP): Dividend Reinvestment
Current Price: $169.62
Per-Share Cost: $88.59 (-0.628% since last update)
Profit/Loss: +91.47%
Allocation: 3.338%* (-0.246% since last update)
Next Buy Target: $161.05
Pepsico (PEP) paid out its quarterly dividend on Friday, January 6, which, after reinvesting, lowered my per-share cost -0.628% from $89.15 to $88.59.
Since initially opening the position on May 13, 2020 with a buy at $132.97, the combination of dividends and Buying and Selling in Stages has lowered my per-share cost a total of -33.38%. Not bad at all when most investors look at Pepsico as a slow moving investment.
iShares Silver ETF (SLV): The Big Finish??? +41.59%!!
Current Price: $21.68
Per-Share Cost: -$0.24 (Explanation below...)
Profit/Loss: +41.59%
Allocation: 0.681%* (-0.322% since last update)
Next Buy Target: No buys planned at this time.
Long-time readers of my Pandemic Portfolio blog know that I did something, well, risky (*cough* stupid *cough*) back in May 2021, selling puts on the iShares Silver ETF (SLV) at $25.00 expiring in January 2023. For each put I sold, I received $375.00 in return as payment, however I was also obligated to buy 100 shares of SLV at $25.00 for each put I sold.
I was bullish on silver and I thought I could capitalize on the gain in silver's price without outlaying any capital. Additionally, since I was bullish on silver, I'd have no problem buying the shares of SLV if the share price was below $25.00 at the time of expiration.
In other words, if SLV closed under $25.00 on Friday, January 20, 2023, I'd have to buy 100 shares of SLV for each put I sold at $25.00 each... no matter how low SLV might be below $25.00.
And, then, over the course of 2022, the price of silver utterly collapsed...
Silver dropped from above $25.00 all the way down to $16.19 in August 2022, a drop of nearly -40% from where I sold puts. In other words, if the price of SLV was $16.19 when my puts expired, my position would be down -35.24%!
*gulp*
However, right near SLV's lows on August 31, 2022, I bought some shares of SLV at $16.70 using some of the proceeds I had made from selling the puts in order to slightly offset my cost basis (which was looking more and more likely to be a very real, very large position at that point).
Well, in the past five months, silver has rocketed more than +40% from its August lows, and while it didn't get above $25.00, it got high enough for me to close the position... with a profit.
On Friday, January 13, the cost of the puts had dropped to such a point that I was able to buy them back for $2.72 each ($272.00 plus fees for each put I sold). After closing the puts, I also sold enough of the shares of SLV that I had bought at $16.70 at $22.34, pulling all of my remaining capital out of the position, and locking in a +33.77% gain in the 5 months since I bought the SLV.
I captured $1.02 of the $3.75 I received for each put, a gain of +27.17% on the trade for a total gain of +41.59% when combined with the value of the SLV shares I still hold at the time of closing, an annualized return of +27.73%. Fantastic returns for a year that saw the S&P down nearly -20%.
Additionally, I now also have a small position in SLV that cost me nothing. In fact, since my cost basis is -$0.24, each share adds +$0.24 to the portfolio in addition to the current value of the shares.
However, since I was risking $2,500 for each put I sold, I look at my real, net gain in terms of the percentage of the total capital I was risking. This means I earned a +6.23% return over the course of the trade on the $2,500 I risked for each 100 shares I would have to buy, an annualized +4.15% return. While that's not a mind-blowing return, I'm still pleased given the possibility of a -20% loss if the same amount had been in the S&P.
At this point, I am keeping the remaining (free) SLV shares I bought as a "lottery ticket" on the current bull run in precious metals. I'll sell a little as SLV continues higher with my first target at $28.00, just under SLV's high from its run from 2020-21.
What if I had waited until the options expired on Friday, January 20?
The question many of you are probably asking is regarding what would have happened if I just waited to get assigned on Friday, January 20? On the day of expiration, SLV closed at $22.02 which means I would have had to buy 100 shares of SLV at $25.00 for every put I sold, leaving the position down -11.92%.
However, since I collected $374.35 per contract (after fees), my actual cost basis would have been $21.26, leaving my position up +3.57%.
At the end of the day, however, since I was able to collect premium for the week ahead when I bought back the option, I actually finished with an extra +9.56% in gains by closing the option position a week earlier, buying them back for $2.72 instead of waiting for when they closed essentially at $2.98.
At this point, I'm going to count myself lucky on this one and I definitely intend to be more careful the next time I get cocky with a long-term options play.
UnitedHealth (UNH): Planned Closure
Current Price: $486.05
Per-Share Cost: $263.54 (Unchanged since last update)
Profit/Loss: +84.43%
Allocation: 4.679%* (-0.499% since last update)
Next Buy Target: -NO BUY TARGET-
UnitedHealth (UNH) had a tough time of it since the last update as investors rolled out of healthcare as the cycles rotated in the market. Additionally, since President Biden hasn't announced whether he plans to run for re-election, many investors are concerned that a Biden's replacement will come out aggressively against healthcare managers, a popular target for Democrat hopefuls.
As a result, I have not been able to close my UNH position at the price I intend to. With UNH having crossed over the $550 mark many times in the past year, my sell target is $546.74 where I will close this position entirely.
As I mentioned last month, after hearing additional allegations against UNH from a number of colleagues who work in the healthcare space, I am no longer keeping this company as an active position.
Waste Management (WM): Strategy Update
Current Price: $152.61
Per-Share Cost: $110.55 (Unchanged since last update)
Profit/Loss: +38.05%
Allocation: 3.696%* (-0.158% since last update)
Next Buy Target: $139.34
Despite the fact that Waste Management's (WM) chart no longer shows it, this stock was one of those affected by a NYSE computer glitch on Tuesday. With WM trading around $150.00 at the time, the stock opened at $134.00, a -10.67% discount, before trading was halted and the stock returned to its normal levels.
Despite the drop to $134.00 potentially indicating significant support at that level, my price target remains at $139.34, above a repeated level of support in the past.
Additionally, I do have plans to take profits again if Waste Management hits my sell target at $169.44, below a past level of resistance.
* Target allocation for each position in the portfolio is 12.50% of the overall portfolio.
Ways to give back to GetIrked:
Send me a tip via Stripe! Thank you!
Get free money by signing up for an account with my referral link for Schwab
Sign up for Gemini and we each get $10
Click this referral link to get the Brave Browser
If you use Brave, you can also use the Tip function to tip me in Basic Attention Token (BAT).
![]()
Disclaimer: Eric "Irk" Jacobson and all other Get Irked contributors are not investment or financial advisers. All strategies, trading ideas, and other information presented comes from non-professional, amateur investors and traders sharing techniques and ideas for general information purposes.
As always, all individuals should consult their financial advisers to determine if an investing idea is right for them. All investing comes with levels of risk with some ideas and strategies carrying more risk than others.
As an individual investor, you are accountable for assessing all risk to determine if the strategy or idea fits with your investment style. All information on Get Irked is presented for educational and informational purposes only.
You must be logged in to post a comment.