Risk Disclaimer
No one at Get Irked is a professional financial adviser. All information provided on this website is for entertainment and educational purposes only. All investments involve risk, all equities could lose value, and investors are responsible for their own choices. Consult with your own financial adviser to see if any of these positions and strategies fit your risk profile and long-term financial goals.

Click image for an enlarged version.
Pandemic Portfolio: Update #13
This is an update to a series. See Starting a Portfolio from Scratch to learn how it started.
Outperformance on the Downside...
Building a portfolio from scratch can be an excruciating experience when done correctly. Watching the market gain and gain while waiting for a position to pull back requires incredible patience and, well, it's boring as all get-out most of the time.
However, weeks like this past one with systemic market-wide selloffs reward me in a few different ways: first, I get to buy more of my stocks at lower prices (they're "on sale!") and second, I get to see how my portfolio performs during a selloff.
So far in 2021, the stocks in the Pandemic Portfolio have underperformed the benchmark index, the S&P 500, by a pretty substantial margin with the biggest difference on the week ending January 22 - a spread of 2.38% with the S&P 500 up +2.27% on the year and the Pandemic Portfolio down -0.11%.
However, this week, the S&P 500 sold off pretty spectacularly, down -3.38% for the week and -1.11% for the year. The Pandemic Portfolio, on the other hand is only down -0.37%.
Granted, you can point to the performance of the Investments in Play or Speculation in Play portfolios, up +2.89% and +1.93% YTD respectively, and make the argument that the Pandemic Portfolio's loss does not constitute outperformance, however, my goal is to beat the S&P 500 benchmark. Sometimes, that means losing less money than it does.
With that, let's take a look at what happened since the last update...
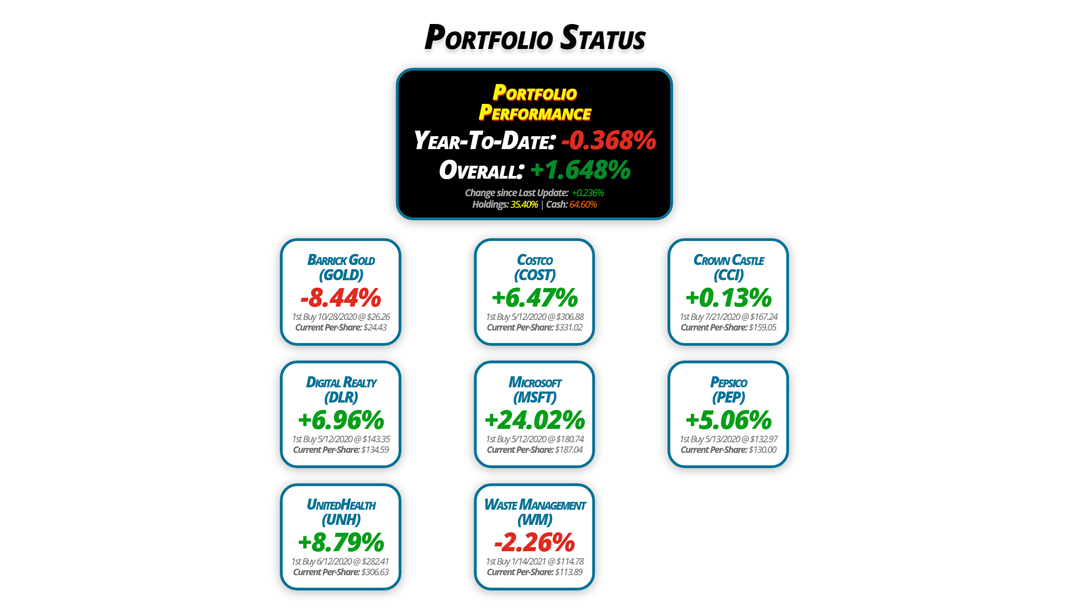
Portfolio Status
Portfolio
Performance
Year-To-Date: -0.368%
Overall: +1.648%
Change since Last Update: +0.236%
Holdings: 35.40% | Cash: 64.60%
Barrick Gold
(GOLD)
-8.44%
1st Buy 10/28/2020 @ $26.26
Current Per-Share: $24.43
Digital Realty
(DLR)
+6.96%
1st Buy 5/12/2020 @ $143.35
Current Per-Share: $134.59
UnitedHealth
(UNH)
+8.79%
1st Buy 6/12/2020 @ $282.41
Current Per-Share: $306.63
Costco
(COST)
+6.47%
1st Buy 5/12/2020 @ $306.88
Current Per-Share: $331.02
Microsoft
(MSFT)
+24.02%
1st Buy 5/12/2020 @ $180.74
Current Per-Share: $187.04
Waste Management
(WM)
-2.26%
1st Buy 1/14/2021 @ $114.78
Current Per-Share: $113.89
Crown Castle
(CCI)
+0.13%
1st Buy 7/21/2020 @ $167.24
Current Per-Share: $159.05
Pepsico
(PEP)
+5.06%
1st Buy 5/13/2020 @ $132.97
Current Per-Share: $130.00
Portfolio Breakdown
Positions
%
Target Position Size

Click image for an enlarged version.

Click image for an enlarged version.
Moves Since Last Update
Barrick Gold (GOLD): Added to Position
Current Price: $22.37
Per-Share Cost: $24.43 (-1.293% from last update)
Profit/Loss: -8.44%
Allocation: 3.961%* (+0.543% from last update)
Next Buy Target: $21.90
The yellow metal saw a lot of weakening against the dollar throughout late January, leading Barrick Gold (GOLD) lower where I added a bit more to my position first at $23.18 on January 22, and again during the market sell off on Wednesday, January 27 at $22.47 (an average price of $22.82).
The combined orders lowered my per-share cost -1.293% from $24.75 to $24.43. From here, my next purchase price is at $21.90, near a past point of support for the stock.
GOLD closed this week at $22.37, down -1.97% from my average buying price.
Costco (COST): Strategy Update
Current Price: $352.43
Per-Share Cost: $331.02 (Unchanged from last update)
Profit/Loss: +6.47%
Allocation: 6.948%* (-0.209% from last update)
Next Buy Target: $302.90
A systemic market-wide selloff spares no one, and Costco (COST) wasn't an exception, dropping -2.69% since the last update. That being said, COST definitely outperforms during a selloff and held up pretty well.
For the moment, I'm pretty content with my allocation, more than half of the 12.5% target at 6.948%. Given that it's hard to say whether this week's selloff was the beginning of a bigger pullback, I'm keeping a low buying price target at $302.90 before I add any more to this epic retailer.
Crown Castle (CCI): Strategy Update
Current Price: $159.26
Per-Share Cost: $159.05 (Unchanged from last update)
Profit/Loss: +0.13%
Allocation: 5.540%* (+0.056% from last update)
Next Buy Target: $150.85
Crown Castle (CCI) finally started seeing some popularity in the past two weeks as investors realized that the 5G rollout combined with CCI's decent dividend makes it a pretty fantastic alternative to bonds.
Despite its bullish action, I'm leaving my price target to add more down at $150.85, a past point of support, as I think CCI may still be trading in a range and could see that downside target if this selloff continues.
Digital Realty Trust (DLR): Dividend Reinvestment
Current Price: $143.95
Per-Share Cost: $134.59 (-0.723% from last update)
Profit/Loss: +6.96%
Allocation: 7.166%* (+0.521% from last update)
Next Buy Target: $130.30
Digital Realty Trust (DLR) paid out its quarterly dividend of $1.12 per share (an annual yield of about 3.25%) on January 19, lowering my per-share cost -0.723% from $135.57 to $134.59.
As always, I use Dividend Reinvestment Programs (DRiPs) whenever possible to take dividend payouts as fractional shares rather than cash in order to compound interest.
Thanks to its substantial rally since the last update, Digital Realty is now the biggest position in the Pandemic Portfolio with an allocation of 7.166%.
Microsoft (MSFT): Strategy Update
Current Price: $231.96
Per-Share Cost: $187.04 (Unchanged from last update)
Profit/Loss: +24.02%
Allocation: 3.441%* (+0.279% from last update)
Next Buy Target: $224.75
Microsoft (MSFT) reported a blowout earnings report this week and skyrocketed to a new all-time high of $242.64 before pulling back to close the week at $231.96.
Its ongoing amazing performance has inspired me to raise my buy target to $224.75, a past point of support that I expect we'll hit if this selloff continues.
Pepsico (PEP): Added to Position
Current Price: $136.57
Per-Share Cost: $130.00 (+1.18% from last update)
Profit/Loss: +5.06%
Allocation: 3.404%* (+0.519% from last update)
Next Buy Target: $128.70
Pepsico (PEP) sold off with the rest of the market on Friday, January 29, triggering a buy order I had in place which filled at $136.14.
As much as I hate buying up my cost basis, I wanted more exposure to this long-term consumer staples play with a decent dividend, so Friday's buy ended up increasing my per-share cost +1.18% from $128.49 to $130.00.
From here, my next buy target is $128.70, a past point of support.
PEP closed the week at $136.57, up +0.32% from where I added Friday.
UnitedHealth (UNH): Added to Position
Current Price: $333.58
Per-Share Cost: $306.63 (+9.899% from last update)
Profit/Loss: +8.79%
Allocation: 3.302%* (+1.612% from last update)
Next Buy Target: $304.10
I've been waiting to add to UnitedHealth (UNH) since I made my first entry back on June 12, 2020 at $282.41. That opportunity came when UNH sold off Wednesday, January 27, hitting my buying price target which filled at $334.60.
This is one of those "I hate buying up cost basis" moves which is actually a high quality problem - UNH shot up after my first buy, and this is the first significant pullback from its all-time high of $367.95 that I've been able to add to. The buy increased my per-share cost by +9.899% from $279.01 to $306.63.
From here, my next price target is $304.10, below my new per-share cost and above a past point of support.
UNH closed the week at $333.58, down -0.30% from where I added Wednesday.
Waste Management (WM): Added to Position
Current Price: $111.32
Per-Share Cost: $113.89 (-0.78% from last update)
Profit/Loss: -2.26%
Allocation: 1.643%* (+1.077% from last update)
Next Buy Target: $106.95
Waste Management (WM) dropped with the rest of the market on Wednesday, January 27, dropping through my next buy target which filled with a small order at $112.11. The order lowered my per-share cost a marginal -0.775% from $114.78 to $113.89.
From here, my next buy target is $106.95, slightly below the 200-Day Moving Average and above a past point of support.
WM closed the week at $111.32, down -0.70% from where I added Wednesday.
* Target allocation for each position in the portfolio is 12.50% of the overall portfolio.
Ways to give back to GetIrked:
Send me a tip via Stripe! Thank you!
Get free money by signing up for an account with my referral link for Schwab
Sign up for Gemini and we each get $10
Click this referral link to get the Brave Browser
If you use Brave, you can also use the Tip function to tip me in Basic Attention Token (BAT).
![]()
Disclaimer: Eric "Irk" Jacobson and all other Get Irked contributors are not investment or financial advisers. All strategies, trading ideas, and other information presented comes from non-professional, amateur investors and traders sharing techniques and ideas for general information purposes.
As always, all individuals should consult their financial advisers to determine if an investing idea is right for them. All investing comes with levels of risk with some ideas and strategies carrying more risk than others.
As an individual investor, you are accountable for assessing all risk to determine if the strategy or idea fits with your investment style. All information on Get Irked is presented for educational and informational purposes only.
You must be logged in to post a comment.