April 24, 2020
Risk Disclaimer
The positions in this portfolio are incredibly risky and extremely volatile.
No one at Get Irked is a professional financial adviser (or a doctor), so consult with your own financial adviser to see if any of these positions fit your risk profile (and stomach).
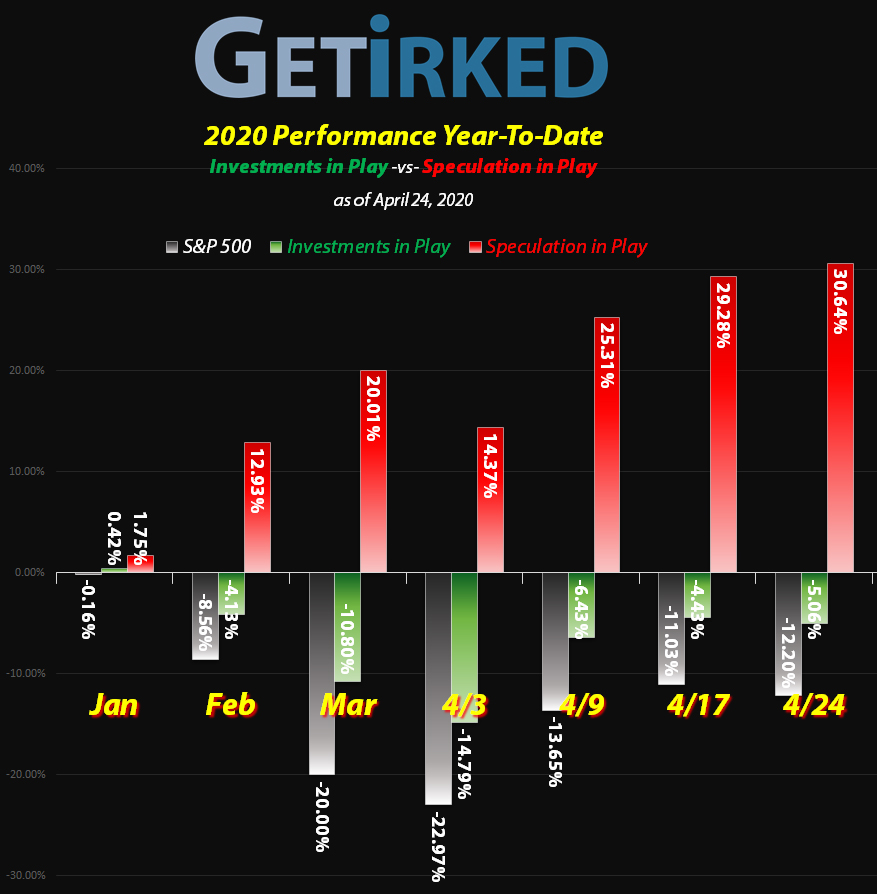
Click image to bring up larger version.
The Week’s Biggest Winner & Loser
Pinterest (PINS)
Somehow, the stock market forgot that Pinterest (PINS) is a social media focusing on arts and crafts during March’s selloff, but they sure remembered this week as buyers caused the stock to pop +18.17%.
Not only does that move give Pinterest this week’s Biggest Winner, but it also puts PINS +10.62% Year-To-Date… not bad!
Revolve Group (RVLV)
Revolve Group (RVLV) dropped -10.13% giving it the week’s Biggest Loser recognition. The timing of this piece of garbage was nuts – after reporting a bad quarter, I was following the Three Day Rule before taking the loss. Well, Day 3 was the beginning of the March selloff…
Here we stand, down -42.48% YTD. Yuck.
Portfolio Allocation
Positions
%
Target Position Size
Current Position Performance
AMD (AMD)*
+543.40%*
1st Buy: 1/10/2019 @ $19.54
Current Per-Share: -($1.29)*
Virgin Galactic (SPCE)*
+298.69%*
1st Buy: 10/31/2019 @ $9.87
Current Per-Share: (-$0.15)*
Tradeweb Mkts (TW)
+113.75%
1st Buy: 4/8/2019 @ $39.22
Current Per-Share: $24.80
Pinterest (PINS)
+72.32%
1st Buy: 5/16/2019 @ $25.72
Current Per-Share: $11.97
Yeti (YETI)
+64.56%
1st Buy: 2/26/2019 @ $23.23
Current Per-Share: $15.12
Chevron (CVX)
+55.53%
1st Buy: 3/12/2020 @ $76.94
Current Per-Share: $55.95
Twitter (TWTR)
+10.54%
1st Buy: 10/30/2019 @ $29.79
Current Per-Share: $26.00
Carnival Cruise (CCL)
-0.14%
1st Buy: 3/12/2020 @ $17.25
Current Per-Share: $11.93
SPY Put Spreads 5/29
-7.87%
Cost: $0.9932
Current Value $0.915
General Electric (GE)
-18.69%
1st Buy: 3/6/2020 @ $9.40
Current Per-Share: $7.70
Revolve Group (RVLV)
-51.06%
1st Buy: 6/13/2019 @ $39.06
Current Per-Share: $21.58
* Indicates a position where the capital investment was sold.
Profit % for * positions = Current Gross Profit / Original Capital Investment
This Week’s Moves
Chevron (CVX): Profit-Taking
When Chevron (CVX) made a run at its recent highs on Thursday, I decided it was time to take some profits, selling some of the shares I bought at $55.56 back on March 18 for a +58.12% gain at $87.85.
The sale lowered my per-share cost by -15.97% from $66.58 to $55.95. My next sell order will pull the rest of my capital out of the position at $110-115. My next buy target is near a 50% retracement of CVX’s run from March low’s: $67.15.
CVX closed the week at $87.01, down -0.96% from where I sold on Thursday.
Pinterest (PINS): Profit-Taking
Pinterest (PINS) has made a pretty substantial recovery since its March lows, leading me to once again take small profits when it rose throughout the week with sell orders filling on Wednesday at $18.06 and more on Friday at $19.53 and $20.64, giving me an average selling price of $19.41.
This week’s orders sold shares I bought at $10.48 back on March 27, locking in 85.21% in profits and lowering my per-share cost -7.85% from $12.99 to $12.40. Even after this week’s sales, I still need to take profits in this position as it is the largest in the portfolio at nearly 11%, exceeding the current target position allocation of 9.09%.
My next sell target is slightly over $23.00 a share, a past point of resistance, and my next buy target is back at $10.10-$10.30, the lows of March.
PINS closed the week at $20.62, up +6.23% from my average selling price.
Put Insurance: *Opened SPY 5/29 278-275*
The markets have rocketed from the lows, and despite the support of the Federal Reserve, there are too many variables for me to be 100% confident that we won’t see a bit of a selloff in May.
So, on Wednesday, I put in a buy order to pick up the SPY 278-275 Put Spread. I learned from my short-term one-week spreads that failed a few weeks ago and opted for spreads expiring on May 29 for under $1.00 a spread (my order filled at $0.9932 per spread).
I’m risking about 2.75% of the portfolio for a potential 8.33% gain if the market sells off below my 275 put by the end of May.
TRADE MAKEUP:
Buy SPY 5/29 278 Puts: -$11.89
Sell SPY 5/29 275 Puts: +$10.90
Total Cost: -$11.89 + $10.90 = $0.9932 per Spread
BREAK-EVEN:
Higher Strike Price: $278
Cost: $0.9932
Break-Even: $278.00 – $0.9932 = $277.0068
MAXIMUM PROFIT:
Lower Strike Price: $275
Break-Even: $277.0068
Maximum Profit: $277.0068 – $275 = $2.0068 per spread
Maximum Gain: $2.0068 / $0.9932 = 202.54% (more than 3 times the investment)
CURRENT STATUS:
Cost of Each Spread: $0.9932
Current Value per Spread: $0.915
P/L %: -7.87%
Want Further Clarification?
As always, if you have questions about any of my positions or have positions of your own that you’re curious about – feel free to leave a comment below!See you next week!

Disclaimer: Eric "Irk" Jacobson and all other Get Irked contributors are not investment or financial advisers. All strategies, trading ideas, and other information presented comes from non-professional, amateur investors and traders sharing techniques and ideas for general information purposes.
As always, all individuals should consult their financial advisers to determine if an investing idea is right for them. All investing comes with levels of risk with some ideas and strategies carrying more risk than others.
As an individual investor, you are accountable for assessing all risk to determine if the strategy or idea fits with your investment style. All information on Get Irked is presented for educational and informational purposes only.


You must be logged in to post a comment.