March 20, 2020

Click image to bring up larger version.
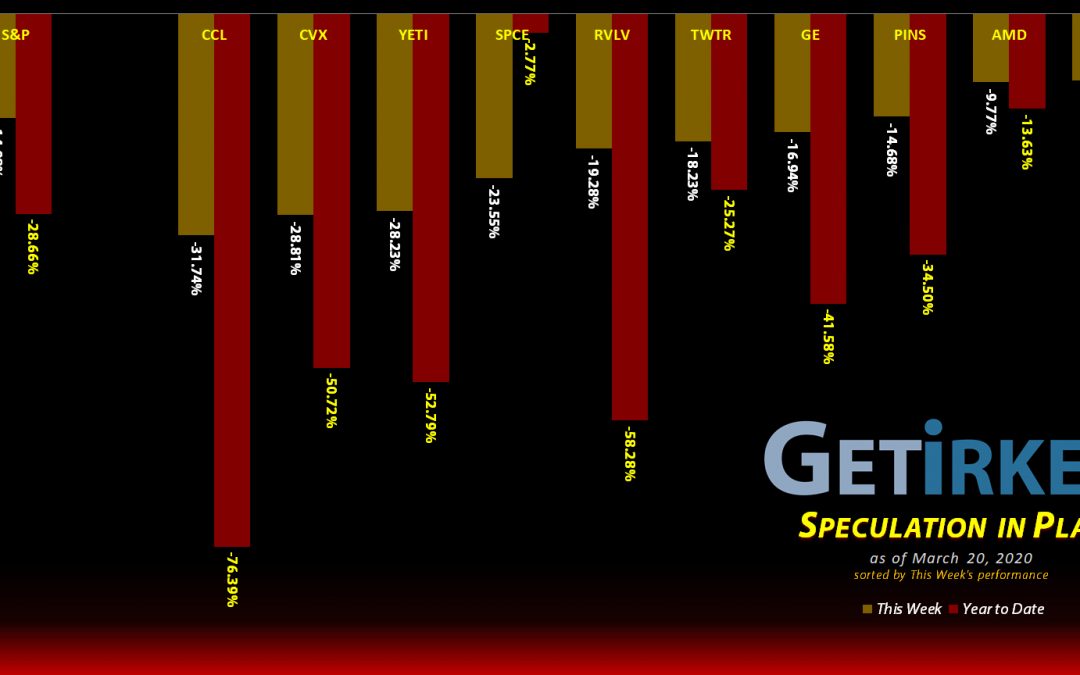
The Week's Biggest Winner & Loser
Tradeweb Markets (TW)
Despite an incredibly turbulent market, Tradeweb Markets (TW) actually held up relatively well, "only" -9.52% and earning itself this week's Biggest Winner.
Carnival Cruiselines (CCL)
Carnival Cruiselines (CCL) continues to get beaten and battered, losing another astounding -31.74% to make its losses an epic -76.39% YTD. Oof. Definitely this week's Biggest Loser.
Portfolio Allocation
Click charts for enlarged versions
Positions
%
Target Position Size

Click image to bring up larger version.
Portfolio Breakdown

Click image to bring up larger version.
Year-to-Date Performance
Current Position Performance
AMD (AMD)*
+415.55%*
1st Buy: 1/10/2019 @ $19.54
Current Per-Share: -($1.29)*
Virgin Galactic (SPCE)*
+231.67%*
1st Buy: 10/31/2019 @ $9.87
Current Per-Share: (-$0.15)*
SPY 3/20 Put Spreads 2
+125.23%
Cost: $1.4932
Selling Value: $3.3664
Tradeweb Mkts (TW)
+10.63%
1st Buy: 4/8/2019 @ $39.22
Current Per-Share: $35.50
Yeti (YETI)
+1.36%
1st Buy: 2/26/2019 @ $23.23
Current Per-Share: $16.15
Twitter (TWTR)
-7.88%
1st Buy: 10/30/2019 @ $29.79
Current Per-Share: $26.00
Pinterest (PINS)
-9.21%
1st Buy: 5/16/2019 @ $25.72
Current Per-Share: $13.45
Carnival Cruise (CCL)
-9.49%
1st Buy: 3/12/2020 @ $17.25
Current Per-Share: $13.26
Chevron (CVX)
-10.80%
1st Buy: 3/12/2020 @ $76.94
Current Per-Share: $66.58
General Electric (GE)
-15.32%
1st Buy: 3/6/2020 @ $9.40
Current Per-Share: $7.70
Revolve Group (RVLV)
-64.50%
1st Buy: 6/13/2019 @ $39.06
Current Per-Share: $21.58
* Indicates a position where the capital investment was sold.
Profit % for * positions = Current Gross Profit / Original Capital Investment
This Week’s Moves
Carnival Cruise Lines (CCL): Added to Position
Following a truly bad day on Monday, Carnival (CCL) completely imploded this week, dropping so far that it tripped several buy orders I had in place, giving me an average buying price of $10.48.
Once again, I'm taking a very slow and conservative approach building this position, however this week's relatively small buys still lowered my per-share cost -19.64% from $16.50 to $13.26. My next buy price target is $7.57.
CCL closed the week at $12.00, up +14.50% from my average buy price.
Chevron (CVX): Added to Position
Despite having two very different theses behind them, Carnival (CCL) and Chevron (CVX) actually trade together given the bad news of this market.
Once again, Chevron continued to drop after Monday's bad day, and, just like CCL above, Chevron hit a record low from the past, filling an order to add slowly at $67.24. Then, on Wednesday, things got much worse and CVX crashed all the way into the mid-$50s where my next buy order filled at $55.56, giving me an average buying price of $61.40 for the week.
The orders lowered my per-share cost by -13.47% from $76.94 to $66.58. My next buy price target is lower still at $50.08.
CVX closed the week at $59.39, down -3.27% from my average buying price.
General Electric (GE): Added to Position
General Electric (GE) didn't drop to my price target when it dipped below $7.00 last week, so when I saw GE drop in pre-market trading on Monday, I used a limit order to add substantially to my position at $6.86.
The order lowered my per-share cost a whopping -12.70% from $8.82 to $7.70. My next buy price target for GE is now near its 2008 crisis low at $5.55 where I'll make an even bigger add than I did on Monday.
GE closed the week at $6.52, down -4.96% from where I added Monday.
Pinterest (PINS): Added to Position
Pinterest (PINS) dropped nearly -20% in Monday's trading, creating new all-time lows and uncharted price territory.
I used Fibonacci Technical Analysis techniques to estimate a few price levels for Pinterest and had orders filled throughout the week for an average buying price of $11.10 per share.
The orders lowered my per-share cost -11.40% from $15.18 to $13.45. For the moment, I'm going to hold off adding any additional shares to my Pinterest position until its price action settles.
PINS closed the week at $12.21, up +10.00% from my average buying price.
SPY Insurance Put Spreads: *Closed: +225.88% Gain*
The sheer quantity of bad news this week was virtually unfathomable, reaching a crescendo of selling on Wednesday so powerful that I decided it was time to close the put spreads that would have expired on Friday instead of risking a massive oversold bounce rally into the weekend.
FINAL TRADE RESULTS:
On Wednesday, I decided 2.25 times my investment was worth capturing so I sold the SPY 3/20 255 Puts I bought for $26.00 and bought the SPY 3/20 251 Puts I sold for $22.64.
Sell SPY 3/20 255 Puts: +$26.00
Buy SPY 3/20 251 Puts: -$22.64
Revenue: $3.36 per spread
Cost: $1.49 per spread
Profit: $1.87 per spread
Gain: $3.364 (sale price) / $1.4932 (buy price) = 2.2588 or +225.88%
Cost of Each Spread: $1.4932
Final Profit/Loss for each Spread: $1.87
Profit over $1.4932 cost of each Spread: +125.23% in profits
Change to the Portfolio YTD: +6.18%
Tradeweb Markets (TW): Added to Position
Tradeweb Markets (TW) resisted the urge to purge all the way until Wednesday when it fully collapsed triggering a number of buy orders and giving me the average buying price of $34.65.
The orders lowered my per-share cost by -0.95% from $35.84 to $35.50. Using Fibonacci Technical Analysis techniques, I'm eyeing $30 as my next buying opportunity.
TW closed the week at $39.27, up +13.33% from my average buy price.
Twitter (TWTR): Added to Position
Twitter (TWTR) collapsed along with everything else this week, tearing through a series of small buy orders I had in place to pick up little nibbles on the way down.
By the end of the week, my average buy price was $22.33 and lowered my per-share cost -7.83% from $28.21 to $26.00. My next price target for Twitter is $19.25.
TWTR closed the week at $23.95, up +7.25% from my average buy price.
Yeti (YETI): Added to Position
Yeti (YETI) truly collapsed this week, falling straight through $20.00 and much, much further, triggering a number of buy orders I had in place which filled for an average buying price of $17.47.
The orders took my per-share cost up to $16.20, still a reduction of -30.26% from where I first bought YETI at $23.23 on February 26 of last year. My next buy target is $15.37 with more significant quantities and wider ranges down from there.
YETI closed the week at $16.42, down -6.01% from my average buy price.
Want Further Clarification?
As always, if you have questions about any of my positions or have positions of your own that you're curious about - feel free to leave a comment below!
You must be logged in to post a comment.