
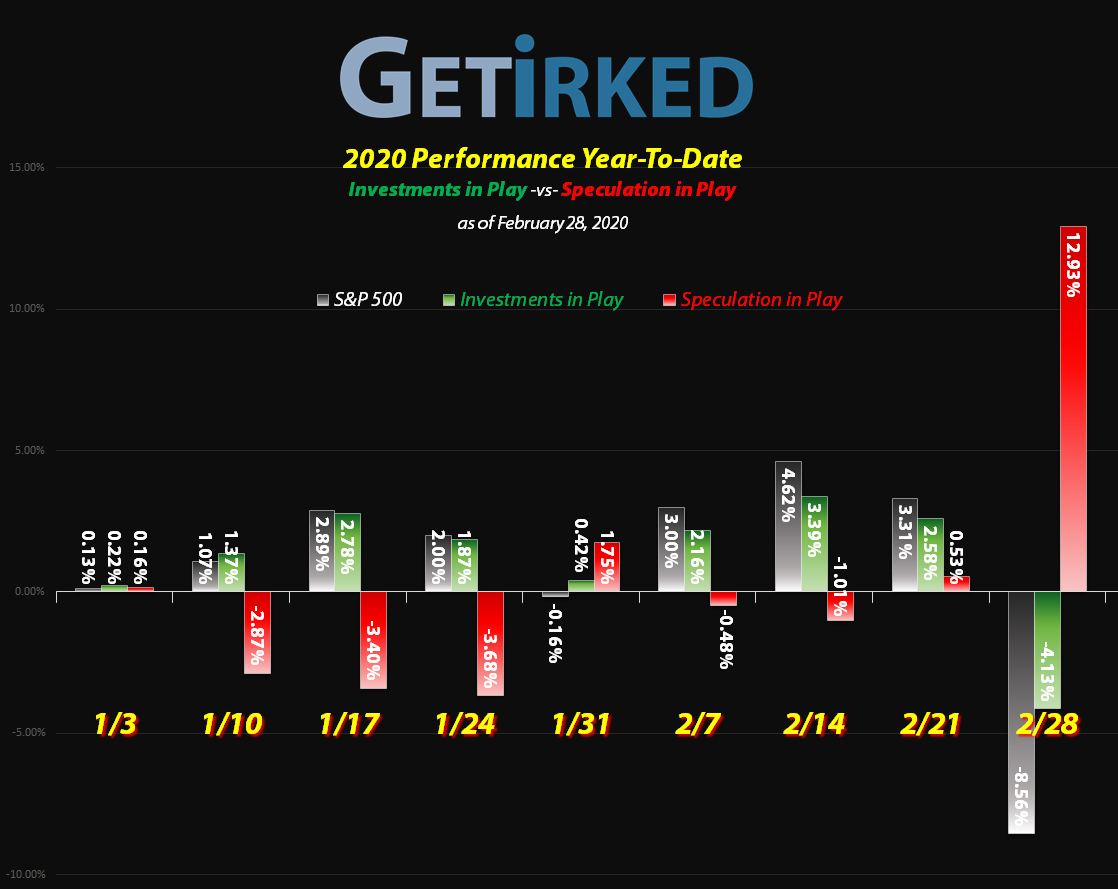
February 28, 2020

The Week's Biggest Winner & Loser
Yeti (YETI)
Weeks like these make it hard to pick a "biggest winner" when it's really the "lesser loser." In this case, Yeti (YETI) lost the least during the epic sell-off, "only" dropping -4.81% when the S&P bombed out -11.49%.
Virgin Galactic (SPCE)
While pundits claim Virgin Galactic (SPCE) flew too close to the sun and got smacked down for its hubris, I disagree. This is a stock that is still up +112.99% for the year even after losing -27.37% this week to be this week's "biggest loser."
Portfolio Allocation
Click charts for enlarged versions
Positions
%
Target Position Size

Portfolio Breakdown
Year-to-Date Performance
Current Position Performance
Yeti (YETI)
+498.22%
1st Buy: 2/26/2019 @ $23.23
Current Per-Share: $5.06
AMD (AMD)*
+443.98%*
1st Buy: 1/10/2019 @ $19.54
Current Per-Share: -($43.68)*
Virgin Galactic (SPCE)*
+386.42%*
1st Buy: 10/31/2019 @ $9.87
Current Per-Share: (-$0.15)*
SPY 3/16 Put Spreads
+119.04%
Cost: $1.33
Current Value: $2.92
Tradeweb Mkts (TW)
+54.22%
1st Buy: 4/8/2019 @ $39.22
Current Per-Share: $31.27
Twitter (TWTR)
+25.54%
1st Buy: 10/30/2019 @ $29.79
Current Per-Share: $26.45
Pinterest (PINS)
+5.25%
1st Buy: 5/16/2019 @ $25.72
Current Per-Share: $18.35
SPY 2/28 Put Spreads
+5.24%
Max Risk: $3.542
Closing Profit: $0.1856
Revolve Group (RVLV)
-35.42%
1st Buy: 6/13/2019 @ $39.06
Current Per-Share: $25.25
* Indicates a position where the capital investment was sold.
Profit % for * positions = Current Gross Profit / Original Capital Investment
This Week’s Moves
Spy 2/28 Vertical Put Spread: Closed: +5.24%
There's an old stock market trader adage: "Better lucky than good."
Last week, I was down nearly -90% in my puts which expired today (Friday, February 28) and it looked like there was no hope - I was going to take a pretty epic hit.
Yes, the timing of this week's selloff fell entirely in the "lucky" side of the adage.
On Monday, the markets collapsed downward after traders and investors finally started taking the coronavirus seriously. I decided it was time to capitalize on the negative volatility and cut some of the losses in my naked puts by selling some SPY 2/28 321 Puts to convert my naked puts back into vertical put spreads.
I sold the SPY 2/28 321 Puts on Monday for +$2.07 each, converting my naked puts into vertical put spreads and reducing the cost of each spread by -$2.07.
Regular readers will remember that I had converted my put spreads to naked puts just two weeks ago by buying back the 317 puts I had sold. I bought those puts back for $0.38 since volatility was so low. Now, I basically made $1.69 in "gains" ($2.07 - $0.38) over just keeping those 317 puts.
Why sell puts again and not just close the trade or extend the trade?
While I could have just closed the trade on Monday and taken the increased value to reduce the trade's overall loss (it was still a loss), selling the 321 Puts allowed me to take advantage of the selloff by locking in some return on Monday in case the market bounced on Tuesday.
However, by keeping the trade on, I was able to still remain in the trade in case the selloff was more substantial over the course of the week to earn a small gain instead of taking a still sizable loss.
Extending the trade by rolling the put spreads into next month would have required me to put even more investment capital into the trade and risk that the market could bounce over the new time-frame (say, if a cure for the coronavirus is found) once again putting me in the position where I'd be waiting for a selloff and losing trade value (now much more) by time decay.
I preferred to clear the slate by capping both my profits and my losses. This way, I can always start a new trade when the opportunity presents itself.
What was the final cost of the trade?
After selling the SPY 2/28 321 Puts on Monday for $2.07, I reduced the final cost of the each spread down to $1.34.
Sell SPY 2/28 321 Puts: +$2.07
Cost of Puts Before Conversion: $3.41
New Cost of each Spread: $3.41 - $2.07 = $1.34
The maximum cost of each spread throughout the trade's life was $3.542 before the intermediate trades I made over the past two months reduced the cost of the trade. This means reducing the cost to $1.34 on Monday capped my maximum loss at -37.83% instead of -100%.
Maximum Loss: $1.34 / $3.542 = 0.378317 or -37.83%
What were the trade's new break-even and profit targets?
BREAK-EVEN: With the new vertical put spreads, I needed the SPY to sell off to my strike price plus the cost of the trade or $321.65 (a selloff of -1.12% from the price of SPY at the time of conversion on Monday at about $325.30). Plus, I only had the four remaining trade days this week to do it.
Break-Even Calculation:
Strike Price: $323
Cost of each Put Spread: $1.34
Break-Even Price: $321.66 ($323.00 - $1.34)
PROFIT MAXIMUM: Since the puts I sold held a strike price just $2 below the strike of the puts I owned, I dramatically capped my maximum profits in order to also cap my losses.
Basically, I decided I didn't mind risking a $1.34 per spread loss in order to place a bet that the SPY might sell off an additional -1.12% throughout the course of the week.
The result is that I could have made as much as the difference between my break-even price ($321.66) and the lower strike ($321.00): $0.66 per spread.
Break-Even: $321.66
Sold Puts Strike Price: $321.00
Maximum Profit: $0.66 ($321.66 - $321.00)
Maximum Gain % Possible: 49.25% = $0.66 / $1.34 (cost of the trade) = 0.49254
Since the actual cost of each spread was $3.542, the actual maximum profit for the trade over its lifetime was 18.63%: $0.66 / $3.542 = 0.18634 or 18.63%.
FINAL TRADE RESULTS:
The market didn't just sell off on Monday, but continued collapsing with even more losses on Tuesday.
Since a lot of this year's profits from some of my luckier trades were tied up in the epic losses of this trade (*cough* Virgin Galactic *cough*), I decided to grab 5% of profits on the entire cost of the trade when my spreads went profitable rather than risking turning a down-90%-to-profitable trade back into a loss.
While I could have easily collected the entire profit target, closing the trade and taking small profits successfully flipped the entire Speculation in Play portfolio from a negligible +0.5% gain on the year to +12.93% YTD effectively (certainly thanks to the next trade below) in just one week of stock market movement.
Given that the S&P is now down -8.56% for the year, that result is fine by me!
Maximum Risk for each Spread: $3.542
Final Profit/Loss for each Spread: $0.1856
Profit over $1.34 cost of each Spread: +13.851%
Profit over $3.542 actual cost of each Spread: +5.239%
Spy 3/16 Vertical Put Spread: *New Position*
The market experienced a relief rally Wednesday morning following the epic selloffs of Monday and Tuesday with the SPY jumping back over $317.
With no positive news of coronavirus containment or treatment and companies continuing to report supply chain disruptions (Toyota (TM) just that morning), I believed the rally would be short-lived and the sell-off would continue.
What's my thesis and catalyst for this trade?
With the ongoing political news and coronavirus out there, my thesis was that we would see the S&P 500 try to test its 200-Day Moving Average ($304 on the SPY) within the next two weeks after the relief rally loses steam.
With new coronavirus cases as my potential catalyst and a jittery market to begin with, I opened a new vertical put spread position on the S&P 500 with a 2-week time horizon, buying the March 16 315 Puts for $5.95 and selling the March 16 311 Puts for $4.61 for a total cost of $1.33 per spread.
Why sell the 311 puts and not the 304 puts?
While I fully expected we would see another sell-off at least test Tuesday's $311.69 low in the next two weeks, I wasn't confident enough at the time of the trade that we'd see a new sell-off to hit the 200-Day Moving Average in that time window.
In order to dramatically reduce the cost of the trade, I decided to cap my profits at around 3:1 odds. In other words, if the SPY sells off under $310 between now and March 16, I have the potential to triple my investment.
Turns out I was wrong with my timing - the markets sold off below the 200-Day the very next day. In order to triple my investment, the market either needs to sell off substantially further or stay below $311 until expiration.
The time decay works in reverse this far out. Since my spreads have 2 weeks until expiration, their value doesn't increase to the maximum profit until we get closer to expiration as the market has more time to bounce between now and expiration.
With this trade, I'm risking 4.3% of the portfolio's entire value to potentially add another +8.6% to the Year-to-Date gain.
How is the trade cost calculated?
Buy the SPY 3/13 315 Puts: -$5.95
Sell the SPY 3/13 311 Puts: +$4.61
Total Cost of each Spread: -$5.95 + $4.61 = -$1.33 debit cost
What are the trade's break-even and profit targets?
BREAK-EVEN: I need the SPY to sell off below the $315 strike price of the Puts I bought plus the cost of the trade, $1.33, so I need the SPY to sell off to $313.67 to break even on the trade before March 16 expiration.
Break-Even Calculation:
Strike Price of the Puts I own: $315
Cost of each Put Spread: $1.33
Break-Even Price: $315.00 - $1.33 = $313.67
PROFIT MAXIMUM: Since the puts I sold have a $311 strike price, I won't make any additional profits if SPY sells off lower than $311 as I have to buy back the SPY 311 Puts I've sold. My maximum profits are capped to the amount between my break-even price, $313.67, and the puts I sold at $311.00 - $2.67 per put.
Maximum Profit Calculation:
Break-Even: $313.67
Sold Puts Strike Price: $311.00
Maximum Profit: $313.67 - $311.00 = $2.67
Maximum Possible Profit: +200.75% = $2.67 / $1.33 (cost of the trade) = 2.0075
$1.33 + $2.67 = $4.00 / $1.33 = 3.0075 (3 times the money!)
What would make me close the trade early and take a loss?
If there is any significant good news about the coronavirus either in terms of containment or potential treatments/cures while the trade is active, I will close the trade and take a loss.
The entire thesis of this insurance play rests on the unknown potential of the virus. If we learn more, the markets will stabilize or even rise on the news.
CURRENT TRADE STATUS:
Cost of each Spread: $1.33
Current Value of each Spread: $2.92
Current Profit/Loss: +119.04%
What am I going to do with the trade now?
For the moment, I'm holding on to these spreads until we see what the market does next. Seeing as how I have two weeks until expiration, one of three things will happen:
1. The market goes down and eventually maximizes the profit in the spreads (at which point I sell).
2. The market stays flat at these levels and my spreads eventually maximize profit as long as the market's below $311 at expiration (at which point I sell).
3. The market starts to go up and reduces the amount of profit in the trade if it crosses above $311. If this happens, it will be how the market goes up that matters - if it's simply an oversold bounce, I'll hang on.
If it goes up because of good news on the coronavirus (which would be great for all of us, but not for this trade), I'll sell the options regardless of whether or not they're profitable.
If expiration nears and the SPY's over $311 on no positive coronavirus news, I'll decide whether to sell the spreads or roll them into a longer-dated option spread.
Advanced Micro Devices (AMD): *Reopened Position*
Oh, Advanced Micro Devices (AMD), how can I stay mad at you? After hitting a spectacular all-time high of $59.27, AMD got positively destroyed during the selloff, dropping nearly -20%.
On Tuesday, I decided to reopen the position by reversing my last move of selling my remaining shares at $54.98 less than two weeks ago during my Valentine's Day massacre.
My buy order filled at $48.34 as AMD made for deeper lows, locking in a -12% discount on the shares I sold in less than two weeks.
Given that this selloff could be truly epic, I'm taking a very cautious approach with new positions, even outperformers like AMD. My next price target is $36.80 and even if it fills, I will still be playing with the house's money in this position.
AMD closed the week at $45.48, down -5.92% from where I reopened Tuesday.
Yeti (YETI): Added to Position
Just like the rest of the market, Yeti (YETI) got truly smacked on Thursday and dropped straight through one of my price targets with a buy order filling at $29.29 and not stopping, dropping deep into the $28 range.
The order replaces shares I sold in January at $37.15, locking in a -21.16% discount, however, it also puts capital back into the position, giving me a per-share price of $5.06.
YETI's long-term prospects and consistent growth are sure to bounce back eventually, however, it may be a bit of a wait. Given that, my next price target is quite a bit lower at $25.55.
YETI closed the week at $30.25, up +3.28% from where I added Thursday.
Want Further Clarification?
As always, if you have questions about any of my positions or have positions of your own that you're curious about - feel free to leave a comment below!
You must be logged in to post a comment.