February 14, 2020

The Week's Biggest Winner & Loser
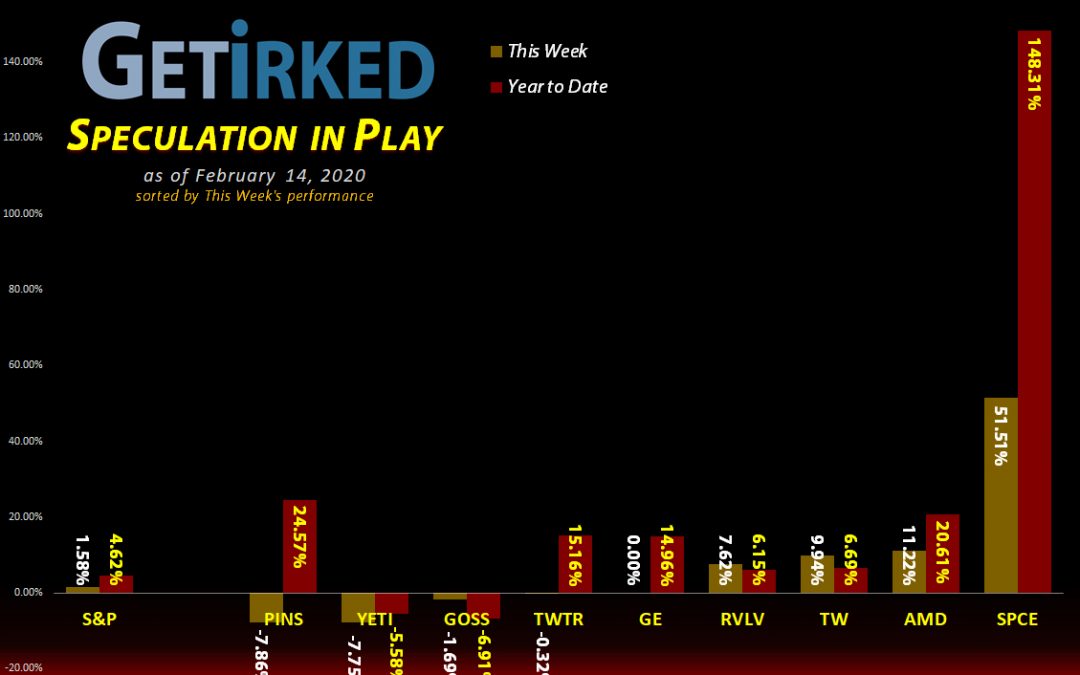
Virgin Galactic (SPCE)
So, yeah, the stock I once called a "raging dumpster fire in space," Virgin Galactic (SPCE) was up +51.51% this week and +148.31% for the year... and it's only February. My bad. Oh, and with a gain like this, AMD's amazing +11.22% is totally (white) dwarfed. <-- Space Pun!!!
Pinterest (PINS)
Why did Pinterest (PINS) lose -7.86% after having such a great quarterly report last week? Because Facebook released a copycat app coming soon to a country near you. Yeah, PINS is now on the Chopping Block for this portfolio because once Big Blue's got their eye on you, you will be the week's Biggest Loser.
Portfolio Allocation
Click charts for enlarged versions
Positions
%
Target Position Size

Portfolio Breakdown

Year-to-Date Performance
Current Position Performance
Yeti (YETI)
+439.17%*
1st Buy: 2/26/2019 @ $23.23
Current Per-Share: -($45.95)*
Virgin Galactic (SPCE)*
+433.64%*
1st Buy: 10/31/2019 @ $9.87
Current Per-Share: (-$0.15)
AMD (AMD)
+220.59%
1st Buy: 1/10/2019 @ $19.54
Current Per-Share: $0.00
Tradeweb Mkts (TW)
+58.16%
1st Buy: 4/8/2019 @ $39.22
Current Per-Share: $31.27
Twitter (TWTR)
+39.57%
1st Buy: 10/30/2019 @ $29.79
Current Per-Share: $26.45
General Electric (GE)
+15.38%
1st Buy: 12/19/2019 @ $11.08
Current Per-Share: $0.00
Pinterest (PINS)
+6.75%
1st Buy: 5/16/2019 @ $25.72
Current Per-Share: $21.75
Gossamer Bio (GOSS)
+4.85%
1st Buy: 12/17/2019 @ $14.51
Current Per-Share: $0.00
Revolve Group (RVLV)
-22.79%
1st Buy: 6/13/2019 @ $39.06
Current Per-Share: $25.25
SPY 2/28 Puts
-89.02%
Cost: 2/12/2020 @ $3.415
Current Value: $0.375
* Indicates a position where the capital investment was sold.
Profit % for * positions = Current Gross Profit / Original Capital Investment
This Week’s Moves
Spy 2/28 Put: Vertical to Naked
When the SPY continued making new highs on Wednesday and volatility (VIX) dropped below 15, I decided the premium on my put spreads had dropped to such a point that it was time to close out the puts I sold to make the trade a simple put option.
I bought back the 317 puts for $0.38 when the SPY broke through $337, raising the cost of each put I hold to $3.415 ($341.50 per contract).
Why buy back the 317 puts?
The low volatility caused the cost of the puts I sold to drop so low that it's worth buying them back as doing so offers me additional options for the trade.
If the markets sell off in the next two weeks, I can either hold on to my naked puts, or, I can sell the 317 puts again when their price rises as the markets sell off, further reducing the cost (and potential losses) of my trade.
Buying the 317 puts back at near the market's highs when their price was lowest offered me more optionality (pun intended) for the trade.
What are the trade's new break-even and profit targets?
BREAK-EVEN: With simple puts, I need the SPY to sell off to less than my strike price ($323) plus the cost of the trade ($3.415), a selloff of -5.17% or more from current levels which may be hoping for too much in the next two weeks.
Strike Price: $323
Cost of each Put: $3.415
Break-Even Price: $319.58 ($323.00 - $3.415)
PROFIT MAXIMUM: Since these are now naked puts, there is no limit on the profit, however, realistically, most analysts believe the market will hold levels of $303-$310, a drop of 8-10% from these levels.
Could that happen in the next two weeks? Not likely, but, if it did, the profits would be $13-20 per contract or 280-486%.
CURRENT TRADE STATUS:
SPY Close on Friday: $337.60 (-5.34% away from break-even *gulp*)
Cost of each Spread : $3.415
Current Value of each Spread at Friday’s Close: $0.375
Profit/Loss: -89.02%
Time Remaining: 14 Days (9 Trading Days)
AMD (AMD): *Closed: +220.59% Profit*
AMD (AMD) has been a spectacular performer, earning the portfolio +220.59% in lifetime gains since I first opened the position on January 10, 2019.
However, with AMD at all-time highs and the markets continuing to feel frothy, I decided it was time to close the position (although revisiting it in the future is never out of the question).
My average selling price was $54.98. Given that my first buy was at $19.54, that's a pretty spectacular move in just a little over 13 months!
AMD closed the week at $55.31, up +0.60% from where I closed on Friday.
General Electric (GE): *Closed: +15.38% Profit*
General Electric (GE) once again leaves Speculation in Play, this time as it lost its ground under $13 on Friday.
My average selling price closed in at $12.78 earning +15.38% in profit in less than two months, having purchased the shares for this trade on Dec 19 at $11.08.
While I think the turnaround is real at GE, I'm freeing up capital to take a more aggressive look at trading in the Speculation in Play portfolio rather than short-to-long term investing.
GE closed the week at $12.83, up +0.39% from where I sold on Friday.
Gossamer Bio (GOSS): *Closed: +4.85% Profit*
I've once again lost my stomach for the volatility of the biopharma space, choosing to close out Gossamer Bio (GOSS) when it lost the $15 mark on Friday with trailing-stop orders filling at an average price of $14.93.
While I had made decent returns of 44.49% and 39.9% in the name last year, there are too many potential negative stories swirling around this one, so I'm taking my +4.85% in gains made since I opened the position again on December 17, 2019 and heading home.
GOSS closed the week at $14.55, down -2.55% from where I closed on Friday.
Tradeweb Markets (TW): Profit-Taking
Tradeweb Markets (TW) started to make an attempt to breakout, but lost ground on Friday which triggered sell orders I had in place to lock in profits which filled at an average price $47.66.
Friday's sales lowered my per-share cost by -11.59% from $35.37 to $31.27.
TW closed the week at $49.45, up +3.76% from where I took profits on Friday.
Twitter (TWTR): Profit-Taking
Twitter (TWTR) really took off after last week's earnings, giving me a decent gain in a position I just opened on October 30, 2019. However, on Friday, TWTR started exhibiting a little weakness which motivated me to take some off the table.
I used stop-limit orders to take profits at $36.98 per share on the shares I purchased for $30.29 on December 12, locking in 22.09% in gains in two months.
The sales reduced my per-share cost by -11.72% from $29.96 to $26.45 per share. I'm eyeing the $30 mark to add back to TWTR should a market-wide sell-off take it back down.
TWTR closed the week at $36.91, down -0.19% from where I sold on Friday.
Virgin Galactic (SPCE): Profit-Taking
Okay, okay... Virgin Galactic (SPCE) - we get it. You're a company offering space tourism, but that doesn't mean your stock needs to act like a rocket ship every week, does it?
In all seriousness, I decided to take profits (again) in SPCE when it broke through $25 on Friday with my trailing stop orders closing at an average price of $25.07.
Friday's orders pulled all of the capital investment out of my position, leaving me to play with the house's money at no cost in less than four months (I opened the position on Halloween 2019).
At this point, I'm not sure if I'll add back to this high-flying, insane position, but this one's too much fun to watch, so I'm just going to let the rest ride and see where it goes from here. Just crazy!
SPCE closed the week at $28.68, up +14.40% from where I sold on Friday.
(Did I mention this one's insane?!)
Yeti (YETI): Profit-Taking
Yeti (YETI) reported a generally good quarter despite missing earnings (sales and revenue were up with forecasts good), however, coronavirus news caused significant weakness in the stock throughout the week.
While I still like this position for the long-term, I decided to pull out my initial capital plus profits when YETI started to fail on its uptrend during Friday trading. I used stop-limit sell orders which filled at an average $34.60 and reduced my per-share cost to -$45.95 per share (i.e. each share gives me $45.95 in profits and I have no capital invested in this position currently).
I will add back in slowly if YETI approaches its 200-day Moving Average currently around $30.69-$30.70.
YETI closed the week at $32.84, down -5.09% from where I sold on Friday.
Want Further Clarification?
As always, if you have questions about any of my positions or have positions of your own that you're curious about - feel free to leave a comment below!
You must be logged in to post a comment.