January 3, 2020

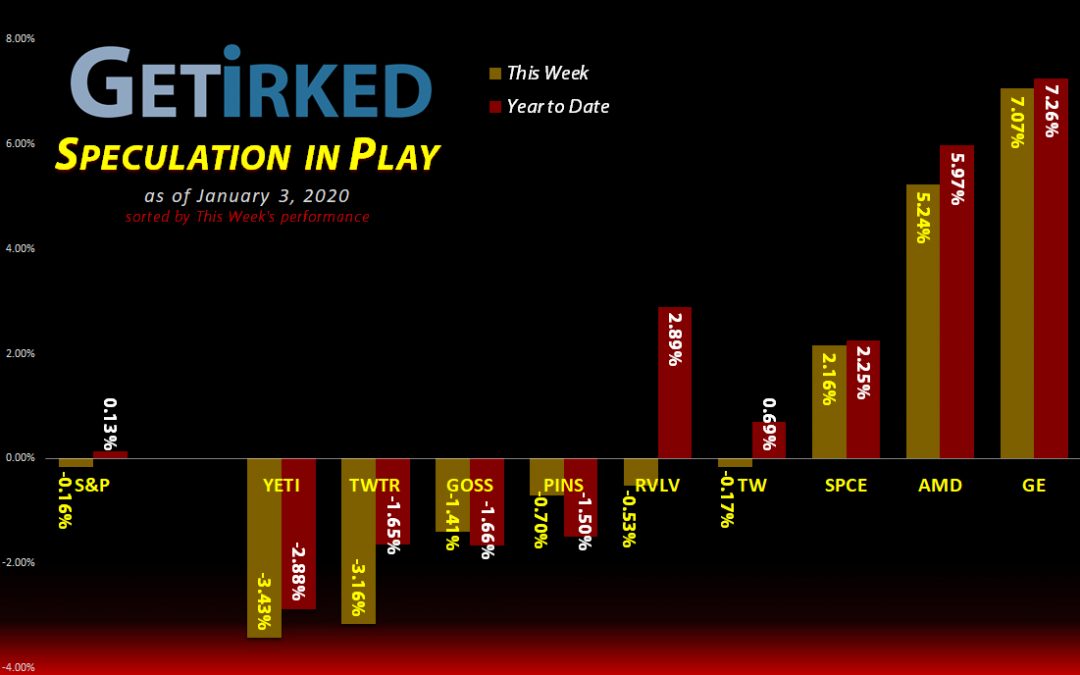
The Week's Biggest Winner & Loser
General Electric (GE)
General Electric (GE) had a great week after Barrons released a report suggesting that Boeing's (BA) new problem is not enough engines for the 737-Max. GE makes engines. The result? A +7.07% pop in the stock earning GE its spot as the first Weekly Winner of 2020!
Yeti (YETI)
Yeti (YETI) is a notoriously volatile stock. How volatile? Well, it kicked off 2019 at $14.84 and closed this week at $33.78, a +127.63% gain in a year! So, when Yeti sold off -3.43% to become the first Weekly Loser of 2020, I'm not holding it against them.
Portfolio Allocation
Click charts for enlarged versions
Positions
%
Target Position Size

Portfolio Breakdown

Year-to-Date Performance
Current Position Performance
Yeti (YETI)
+255.58%
1st Buy: 2/26/2019 @ $23.23
Current Per-Share: $9.50
AMD (AMD)
+212.23%*
1st Buy: 1/10/2019 @ $19.54
Current Per-Share: (-$37.04)*
Virgin Galactic (SPCE)
+34.66%
1st Buy: 10/31/2019 @ $9.87
Current Per-Share: $8.77
Tradeweb Mkts (TW)
+31.97%
1st Buy: 4/8/2019 @ $39.22
Current Per-Share: $35.37
General Electric (GE)
+8.07%
1st Buy: 12/19/2019 @ $11.08
Current Per-Share: $11.08
Gossamer Bio (GOSS)
+5.95%
1st Buy: 12/17/2019 @ $14.51
Current Per-Share: $14.51
Twitter (TWTR)
+5.22%
1st Buy: 10/30/2019 @ $29.79
Current Per-Share: $29.96
Pinterest (PINS)
-15.76%
1st Buy: 5/16/2019 @ $25.72
Current Per-Share: $21.80
Revolve Group (RVLV)
-25.16%
1st Buy: 6/13/2019 @ $39.06
Current Per-Share: $25.25
SPY 312 Jan 31 Put
-35.01%
Cost: 12/30/2019 @ $2.67
Current Value: $1.735
* Indicates a position where the capital investment was sold.
Profit % for * positions = Current Gross Profit / Original Capital Investment
This Week’s Moves
SPY Put 312 Jan 31: Rollover Spread-to-Naked
As we approached the end of the year, the market started to selloff on Monday, more than -0.5%. The market movement had a substantial affect to my 319-308 Vertical Put Spread, increasing the value of the 12/31 319 Puts I owned without affecting the cost of the 308 Puts I sold.
With analysts predicting an almost-guaranteed sell-off of some amount in January as investors and traders take deferred profits from 2019 combined with some more "exuberant" Bears predicting selloffs of between 10-20%, I wanted to have some protection while also capitalizing on still having some value in an option spread expiring in less than one trading day.
On Monday, I bought back the 308 Puts I sold for $0.01 (just in case something weird happened between today and expiration causing the put to increase in value) and rolled over my 12/31 319 Puts into 1/31 312 Puts.
What is "rolling over an option?"
Basically, rolling over an option is just a fancy way of saying I sold the 12/31 puts I owned and used the proceeds to purchase the SPY Jan 31 312 Puts. In this case, I sold my Dec 31 puts for $0.33 and bought the Jan 31 puts for $2.30, to capture the naked put for a net cost of $1.97.
However, I also need to account for the original cost of the 319-308 Vertical Put Spreads I bought at $0.70, bringing the total cost of each put to $2.67.
What is the thesis of the new trade?
I purchased the SPY Jan 31 312 Puts instead of puts with a higher strike price based on a number of factors including cost, potential market movement, and previous price levels.
A drop from the SPY's $323.79 high made last Friday to $312 is only -3.64%. I believe that a 5% sell-off in January isn't expecting too much, and such a drop would give us a price target of $307.60, right where we saw support in December when the market sold off following Trump's tweets before the Phase One Trade Deal was announced.
In order for my puts to become fully profitable (the cost of the rollover plus the cost of the initial spread), I need the market to sell off to my strike price of $312 plus the $2.67 net cost of each put:
$312 - $2.67 = $309.33 <-- Break-even price
Anything lower than $309.33 will result in profits for my puts, with unlimited potential downside protection as these are now naked puts, not put spreads. In other words, without having to buy back lower Puts, I have no limits on potential profits.
If the market sells off 20% from its high in January as some of our crazier Bears are predicting (which I personally believe is highly unlikely), that would give SPY a price target of below $259.03.
The profit potential at that point would then be:
$309.33 (put break-even price) - $259.03 = $50.30 x 100 = $5,030 per put
Or profits of: $50.30 (profit) / $2.67 (cost) = +1,884%!
Well, that's great, but, seriously, what's a more realistic target?
Let's look at the potential profits for these puts if the market has a more routine sell-off of 5% to a maximum of 10% at 2.5% increments:
If the market sells off 5%, the puts will be worth:
$323.79 * 0.95 = $307.60.
$309.33 - $307.60 = $1.73 (profit)
$1.73 (profit) / $2.67 (cost) = +64.79% in profit
If the market sells off 7.5%, the puts will be worth:
$323.79 * 0.925 = $299.51
$309.33 - $299.51 = $9.82 (profit)
$9.82 (profit) / $2.67 (cost) = +367.79% in profit
If the market sells off 10%, the puts will be worth:
$323.79 * 0.90 = $291.41
$309.33 - $291.41 = $17.92 (profit)
$17.92 (profit) / $2.67 (cost) = +671.16% in profit
Despite the longer timeline and higher probability (at least, I think there's a higher probability) of the puts being profitable by the end of January, I still locked the allocation for my puts at under the 10% target for 10 positions in my portfolio to limit risk.
If the puts expire worthless, i.e. the SPY closes January higher than $309.33, I stand to put my Speculation in Play portfolio down about -6.05% for the year as I lose the entire cost of the puts - a significant loss by any stretch, however, not impossible to rectify by the end of the year.
On the other hand, if the market sells off a garden-variety 5% by the end of January as people take profits from a record-breaking 2019, I stand to make over 60% in profits on my puts with, quite frankly, ridiculous potential if something truly serious happens over the course of the next month.
Current Status
Cost of each Put : $2.67
Current Value of each Put at Friday's Close: $1.735
Profit/Loss: -35.01%
Want Further Clarification?
As always, if you have questions about any of my positions or have positions of your own that you're curious about - feel free to leave a comment below!
You must be logged in to post a comment.