January 26, 2024
Risk Disclaimer
The positions in this portfolio are incredibly risky and extremely volatile.
No one at Get Irked is a professional financial adviser (or a doctor), so consult with your own financial adviser to see if any of these positions fit your risk profile (and stomach).
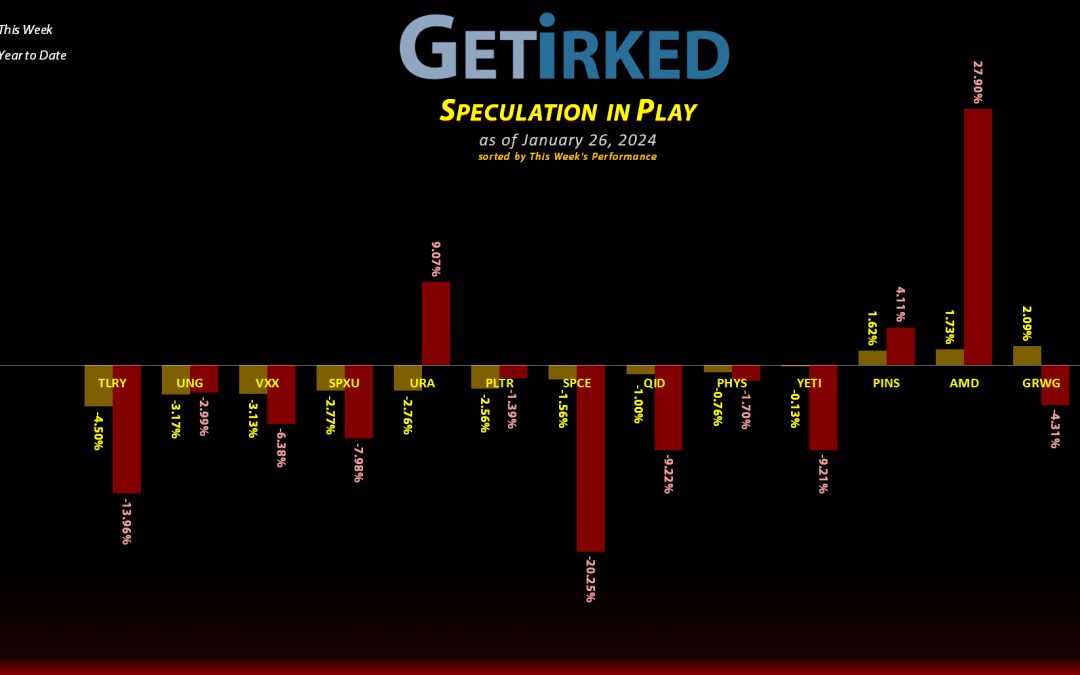
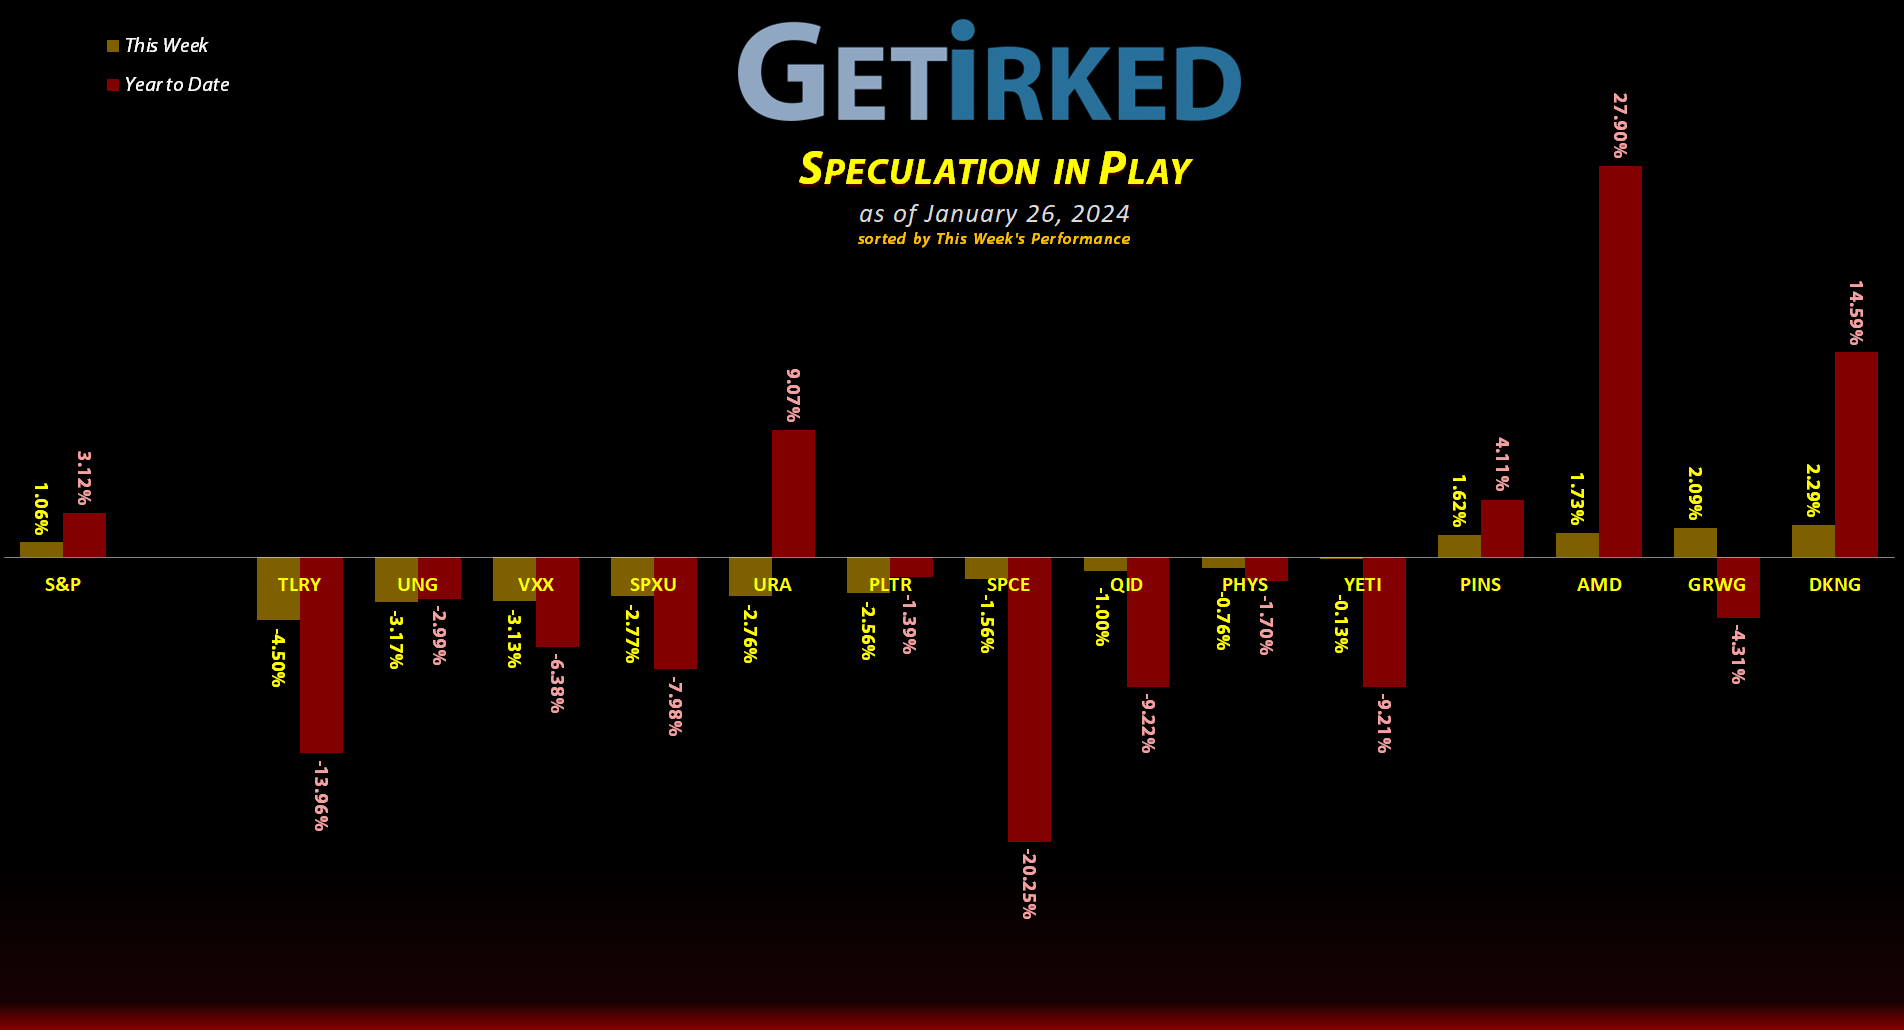
Click image to bring up larger version.
The Week’s Biggest Winner & Loser
DraftKings (DKNG
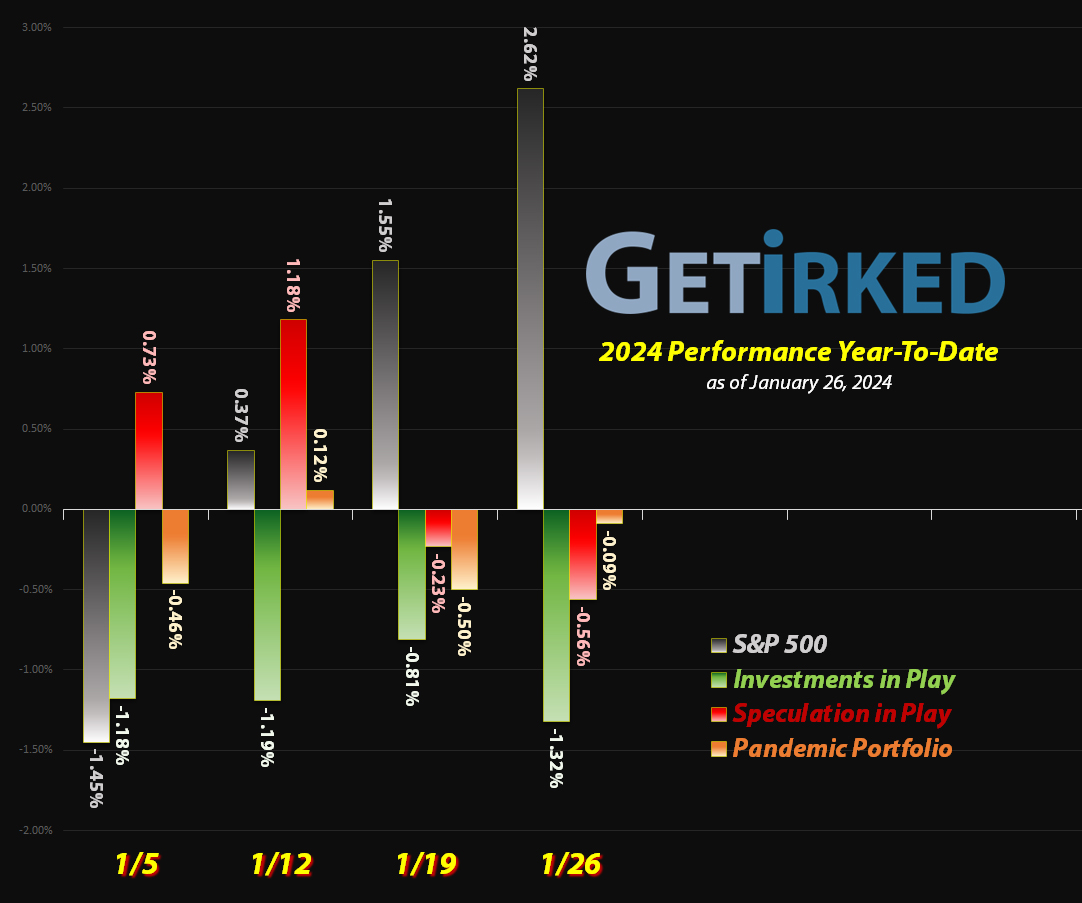
DraftKings (DKNG) popped in sympathy this week with its rival, FanDuel, which reported blowout interest in sports gambling. As a result, DKNG popped+2.29% and, in a general mediocre week for the Speculation in Play portfolio, was enough to earn it the spot of the Week’s Biggest Winner.
Tilray Brands (TLRY)
Volatility in the cannabis space continues to run rampant as traders keep guessing as to when/if the DEA will declassify marijuana from being a Schedule I narcotic. As a result, Tilray Brands (TLRY) sold off -4.50% with the rest of the sector, sliding in as the Week’s Biggest Loser.
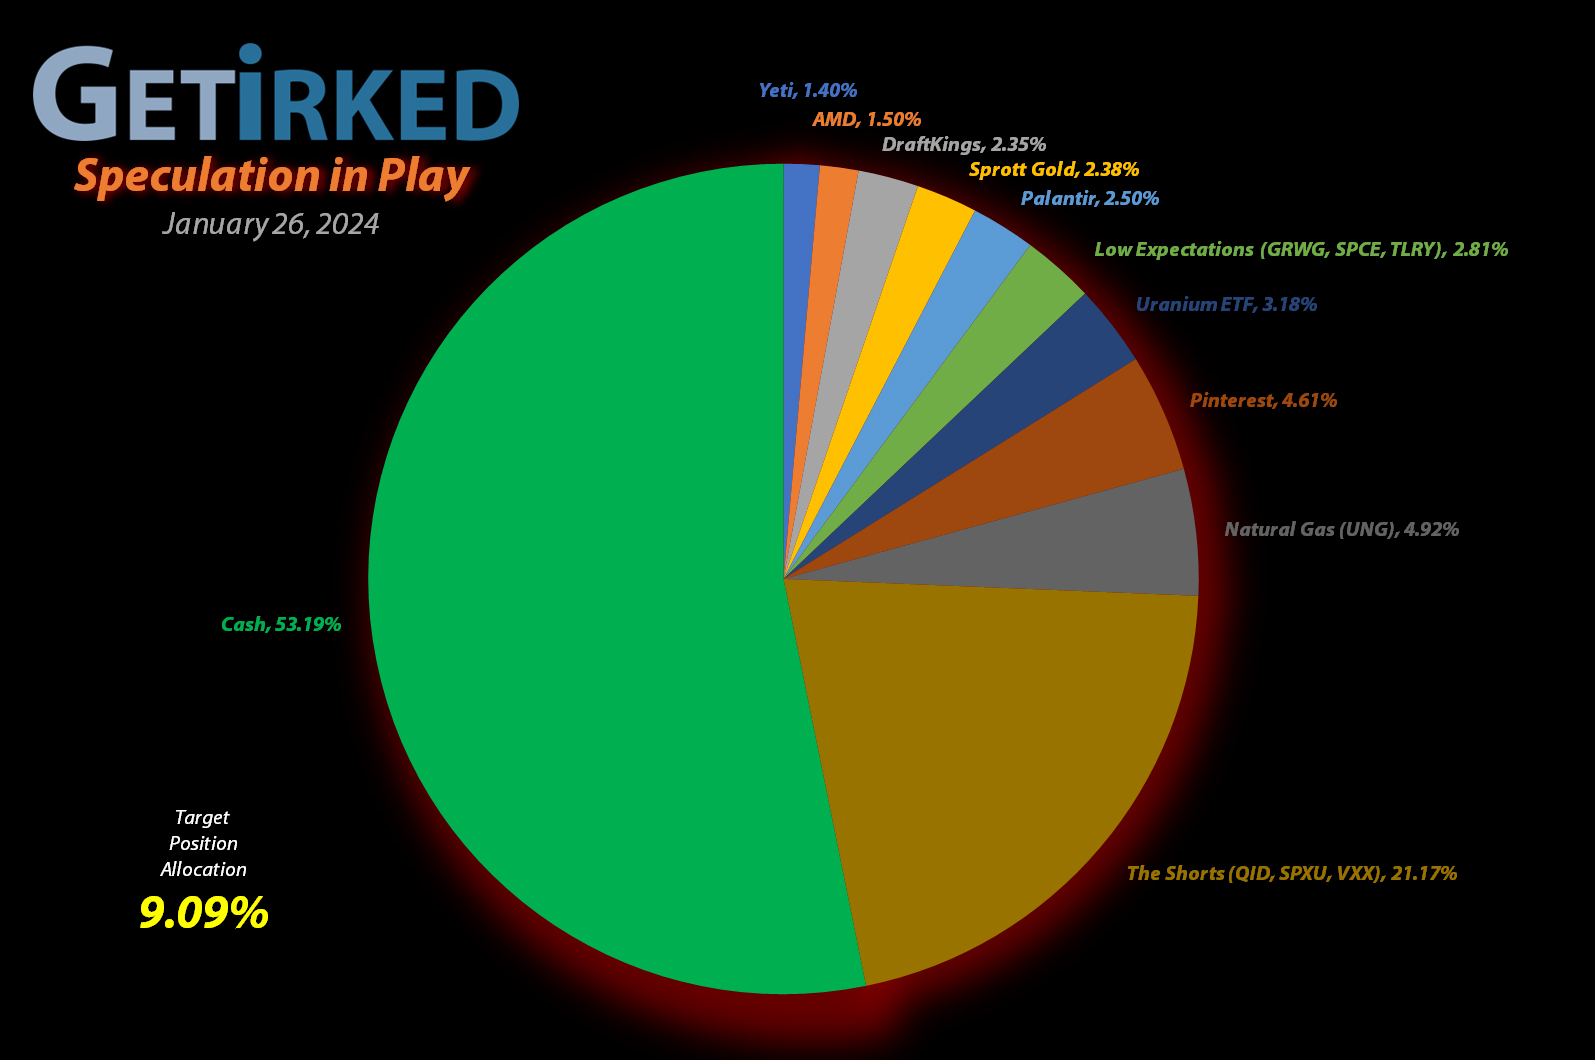
Portfolio Allocation
Positions
%
Target Position Size
Current Position Performance
AMD (AMD)
+804.40%*
1st Buy: 1/10/2019 @ $19.54
Current Per-Share: (-$960.72)*
Pinterest (PINS)
+442.22%*
1st Buy: 5/16/2019 @ $25.72
Current Per-Share: (-$45.39)*
Yeti (YETI)
+404.02%*
1st Buy: 2/26/2019 @ $23.23
Current Per-Share: (-$145.01)*
Uranium ETF (URA)
+164.13%
1st Buy: 2/23/2021 @ $17.97
Current Per-Share: $11.21
Virgin Galactic (SPCE)
+95.73%*
1st Buy: 10/31/2019 @ $9.87
Current Per-Share: (-$2.20)*
Tilray Brands (TLRY)
+48.27%*
1st Buy: 9/21/2018 @ $128.97
Current Per-Share: (-$3.75)*
DraftKings (DKNG)
+34.99%
1st Buy: 1/29/2021 @ $52.97
Current Per-Share: $28.51
Sprott Gold Trust (PHYS)
+6.85%
1st Buy: 6/5/2023 @ $15.25
Current Per-Share: $14.60
Palantir (PLTR)
+6.34%
1st Buy: 2/12/2021 @ $31.50
Current Per-Share: $15.37
The “VIX” (VXX)
-20.15%
1st Buy: 11/2/2023 @ $21.75
Current Per-Share: $18.20
Short SPY (SPXU)
-21.32%
1st Buy: 3/9/2023 @ $14.75
Current Per-Share: $10.25
Short QQQ (QID)
-29.17%
1st Buy: 3/7/2023 @ $20.20
Current Per-Share: $14.05
U.S. Natural Gas (UNG)
-29.79%
1st Buy: 1/30/2023 @ $37.20
Current Per-Share: $28.66
Grow Gen (GRWG)
-81.99%
1st Buy: 10/30/2020 @ $16.04
Current Per-Share: $13.55
* Indicates a position where the capital investment was sold.
Profit % for * positions = Current Total Profit / Original Capital Investment
This Week’s Moves
Advanced Micro Devices (AMD): Profit-Taking
With Advanced Micro Devices nearly doubling from its October lows less than three months ago to make new all-time highs right before reporting earnings next week, I decided it was time to severely reduce my exposure with an order that sold 72.34% of my position at $180.72 on Thursday.
While I do believe in AMD for the long-term (it’s one of the oldest positions in this portfolio, first purchased on January 10, 2019 at $19.54/shr), I’m skeptical that CEO Lisa Su can pull a big enough rabbit out of the hat in next week’s earnings report to possibly live up to the expectations that the market has baked in at this point. If I’m wrong, I will be happy to buy back these shares at post-earnings highs.
The sale locked in +273.85% in gains on shares I bought for $48.34 back on February 25, 2020 and lowered my per-share “cost” -$825.71 from -$135.01 down to -$960.72 (a negative per-share cost indicates all capital has been removed in addition to $960.72 per share added to the portfolio’s bottom line in addition to each share’s current value).
From here, I do not have any additional sell targets as I have no need to take any additional profit out of this position while we wait on earnings, but I will start buying back shares on any pullback with my next buy target at $145.89.
AMD closed the week at $177.25, down -1.92% from where I took profits.
Natural Gas (UNG): 1-for-4 Reverse Split
The funny thing about an investment instrument that tracks the futures of a commodity, like the U.S. Natural Gas Fund (UNG), is that it’s destined to go to zero. Thanks to cost of playing the future markets, the fund has built-in “contango,” in other words, the cost of the future contracts is less than the current month’s contracts. Add that with the maintenance costs, and UNG is regularly headed to zero.
As a result, it’s common for these funds to execute “reverse-splits” which UNG executed on Wednesday. In this case, a reverse split gives each shareholder one share for every four they hold (a 1:4 split). The result is the share price is multiplied by the reverse-split, in this case by four, making it so the fund can survive without going to zero.
So, while it looks like my cost basis increased exponentially from $7.15 to $28.66, that’s simply a result of the reverse-split.
The VIX “Fear Index” (VXX): Added to Position
What will likely be my disastrous experiment going long the Volatility Index (VIX), also called the “Fear Index,” continued on Wednesday when VXX, my Barclays’ short-term play on the VIX, made new lows and triggered my next buy order which added 3.70% to the position at $13.97.
The buy lowered my per-share cost -1.89% from $18.55 to $18.20. From here, I will, yes, continue throwing good money after bad with my next buy target at $13.33, a price calculated using Fibonacci Retracement, My next sell target is $18.46, slightly above my cost basis, where I will reduce the size of this ill-fated position.
As a reminder, going long the VIX is dumb. I mean, really, really dumb. That’s why I’m doing it with a very small allocation in a speculative portfolio dedicated to letting me make really dumb moves without risking too much money. And, let’s be clear: I’m prepared to lose every dollar I put into this VIX play – that’s just how dumb it is.
VXX closed the week at $14.53, up +4.00% from where I added Wednesday.


