January 19, 2024
Risk Disclaimer
The positions in this portfolio are incredibly risky and extremely volatile.
No one at Get Irked is a professional financial adviser (or a doctor), so consult with your own financial adviser to see if any of these positions fit your risk profile (and stomach).

Click image to bring up larger version.
The Week's Biggest Winner & Loser
AMD (AMD)
Advanced Micro Devices (AMD) exploded to the upside after hinting at huge sales numbers thanks to its graphics units targeting artificial intelligence. AMD popped a pretty incredible +18.88% to land in as the Week's Biggest Winner.
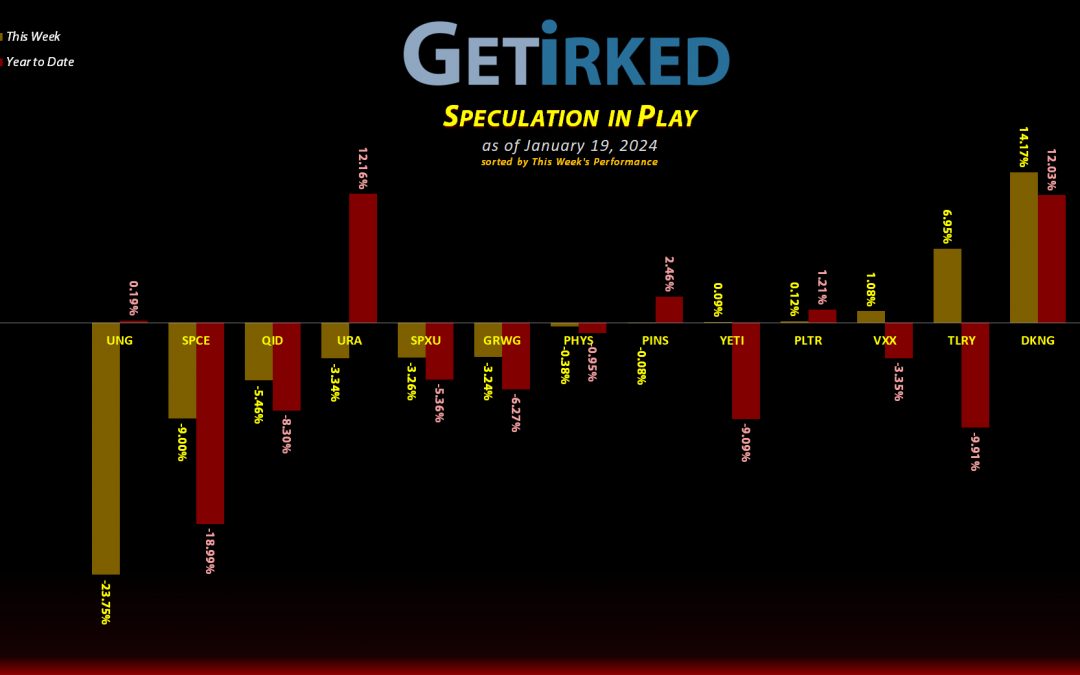
Natural Gas (UNG)
They don't call it "The Widowmaker" for nothing! Natural gas giveth and then it taketh away. After rallying significantly for much of January, the U.S. Natural Gas Fund (UNG) rolled over in a big way this week and gave nearly everything back thanks to reports of warmer weather internationally. UNG dropped an astounding -23.75% on the week, leaving it with a measly +0.19% gain on the year and easily earning it the spot of the Week's Biggest Loser.
Portfolio Allocation
Positions
%
Target Position Size

Click image to bring up larger version.
Portfolio Breakdown

Click image to bring up larger version.
Year-to-Date Performance
Current Position Performance
AMD (AMD)
+790.29%*
1st Buy: 1/10/2019 @ $19.54
Current Per-Share: (-$135.01)*
Pinterest (PINS)
+439.03%*
1st Buy: 5/16/2019 @ $25.72
Current Per-Share: (-$45.39)*
Yeti (YETI)
+404.15%*
1st Buy: 2/26/2019 @ $23.23
Current Per-Share: (-$145.01)*
Uranium ETF (URA)
+171.63%
1st Buy: 2/23/2021 @ $17.97
Current Per-Share: $11.21
Virgin Galactic (SPCE)
+96.32%*
1st Buy: 10/31/2019 @ $9.87
Current Per-Share: (-$2.20)*
Tilray Brands (TLRY)
+49.04%*
1st Buy: 9/21/2018 @ $128.97
Current Per-Share: (-$3.75)*
DraftKings (DKNG)
+31.98%
1st Buy: 1/29/2021 @ $52.97
Current Per-Share: $28.51
Palantir (PLTR)
+9.14%
1st Buy: 2/12/2021 @ $31.50
Current Per-Share: $15.37
Sprott Gold Trust (PHYS)
+7.67%
1st Buy: 6/5/2023 @ $15.25
Current Per-Share: $14.60
Short SPY (SPXU)
-19.12%
1st Buy: 3/9/2023 @ $14.75
Current Per-Share: $10.25
The "VIX" (VXX)
-19.03%
1st Buy: 11/2/2023 @ $21.75
Current Per-Share: $18.55
U.S. Natural Gas (UNG)
-26.88%
1st Buy: 1/30/2023 @ $9.30
Current Per-Share: $7.15
Short QQQ (QID)
-28.45%
1st Buy: 3/7/2023 @ $20.20
Current Per-Share: $14.05
Grow Gen (GRWG)
-82.36%
1st Buy: 10/30/2020 @ $16.04
Current Per-Share: $13.55
* Indicates a position where the capital investment was sold.
Profit % for * positions = Current Total Profit / Original Capital Investment
This Week’s Moves
Short Nasdaq-100 ETF (QID): Added to Position
My relentless foray into my "good money after bad" trades with my leveraged inverse ETFs continued on Friday when the Nasdaq continued to rally, causing my short ETF position, the ProShares UltraShort QQQ ETF (QID), to drop through my next buy target, adding 4.82% to the position at $10.34.
Once again, this is a high-risk position and I wouldn't be playing with it anywhere but in my speculative portfolio where I'm using incredibly-small, incredibly-controlled position sizing and I am prepared to lose the entire amount I'm risking.
The buy lowered my per-share cost -1.75% from $14.30 to $14.05. From here, my next buy target is $9.00 where I will, yes, again add more funds to this bloated position. My next sell target is $14.08 where I will sell the vast majority of the position to reduce my exposure.
QID closed the week at $10.05, down -2.80% from where I added Friday.
Short S&P 500 ETF (SPXU): Added to Position
While the tech and growth stocks are certainly rallying faster than the other sectors, the S&P 500 was no slouch, either. On Friday, the S&P 500 rallied which meant my leveraged inverse ETF position, the ProShares UltraPro Short S&P 500 ETF (SPXU), dropped through my next buy target which added 7.68% to my position at $8.46.
This buy lowered my per-share cost -2.57% from $10.52 to $10.25. From here, my next buy target is $7.65, a price calculated using the Fibonacci Method, and my next sell target is $10.54, just under a past point of resistance.
Once again, I need to point out how stupid it is that I'm trading these inverse ETFs, but that's why I created the speculative portfolio in the first place. These are high-risk instruments and anyone investing with them should be prepared to lose all of the money they have at risk.
SPXU closed the week at $8.29, down -2.00% from where I added Friday.