December 29, 2023
Risk Disclaimer
The positions in this portfolio are incredibly risky and extremely volatile.
No one at Get Irked is a professional financial adviser (or a doctor), so consult with your own financial adviser to see if any of these positions fit your risk profile (and stomach).
Click image to bring up larger version.
2023’s Best & Worst
DraftKings (DKNG)
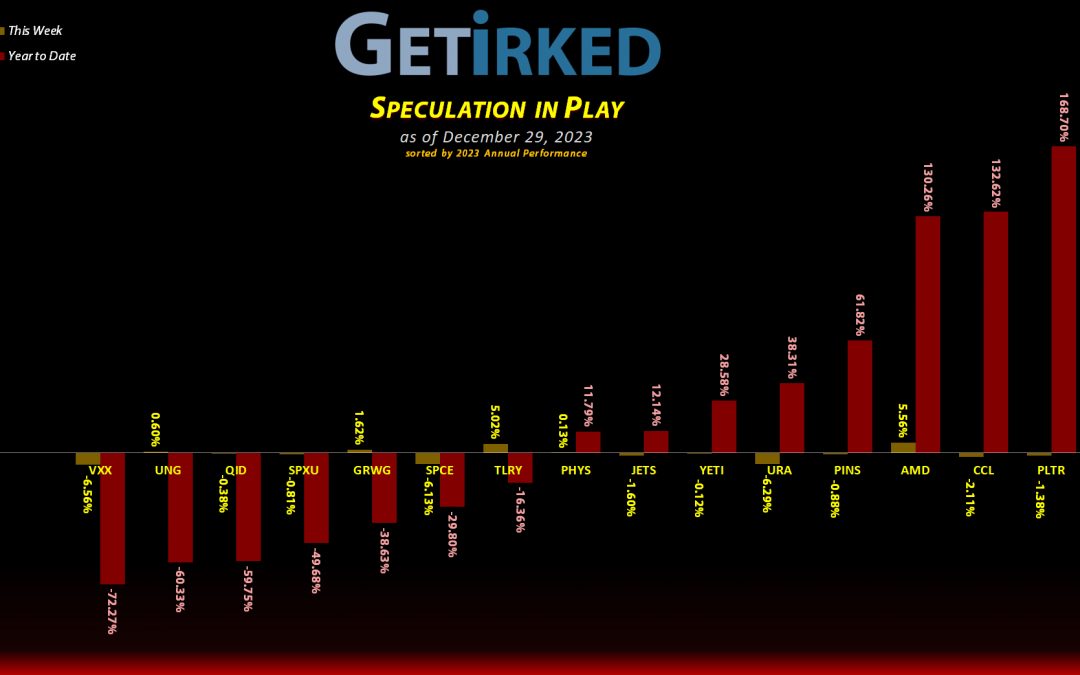
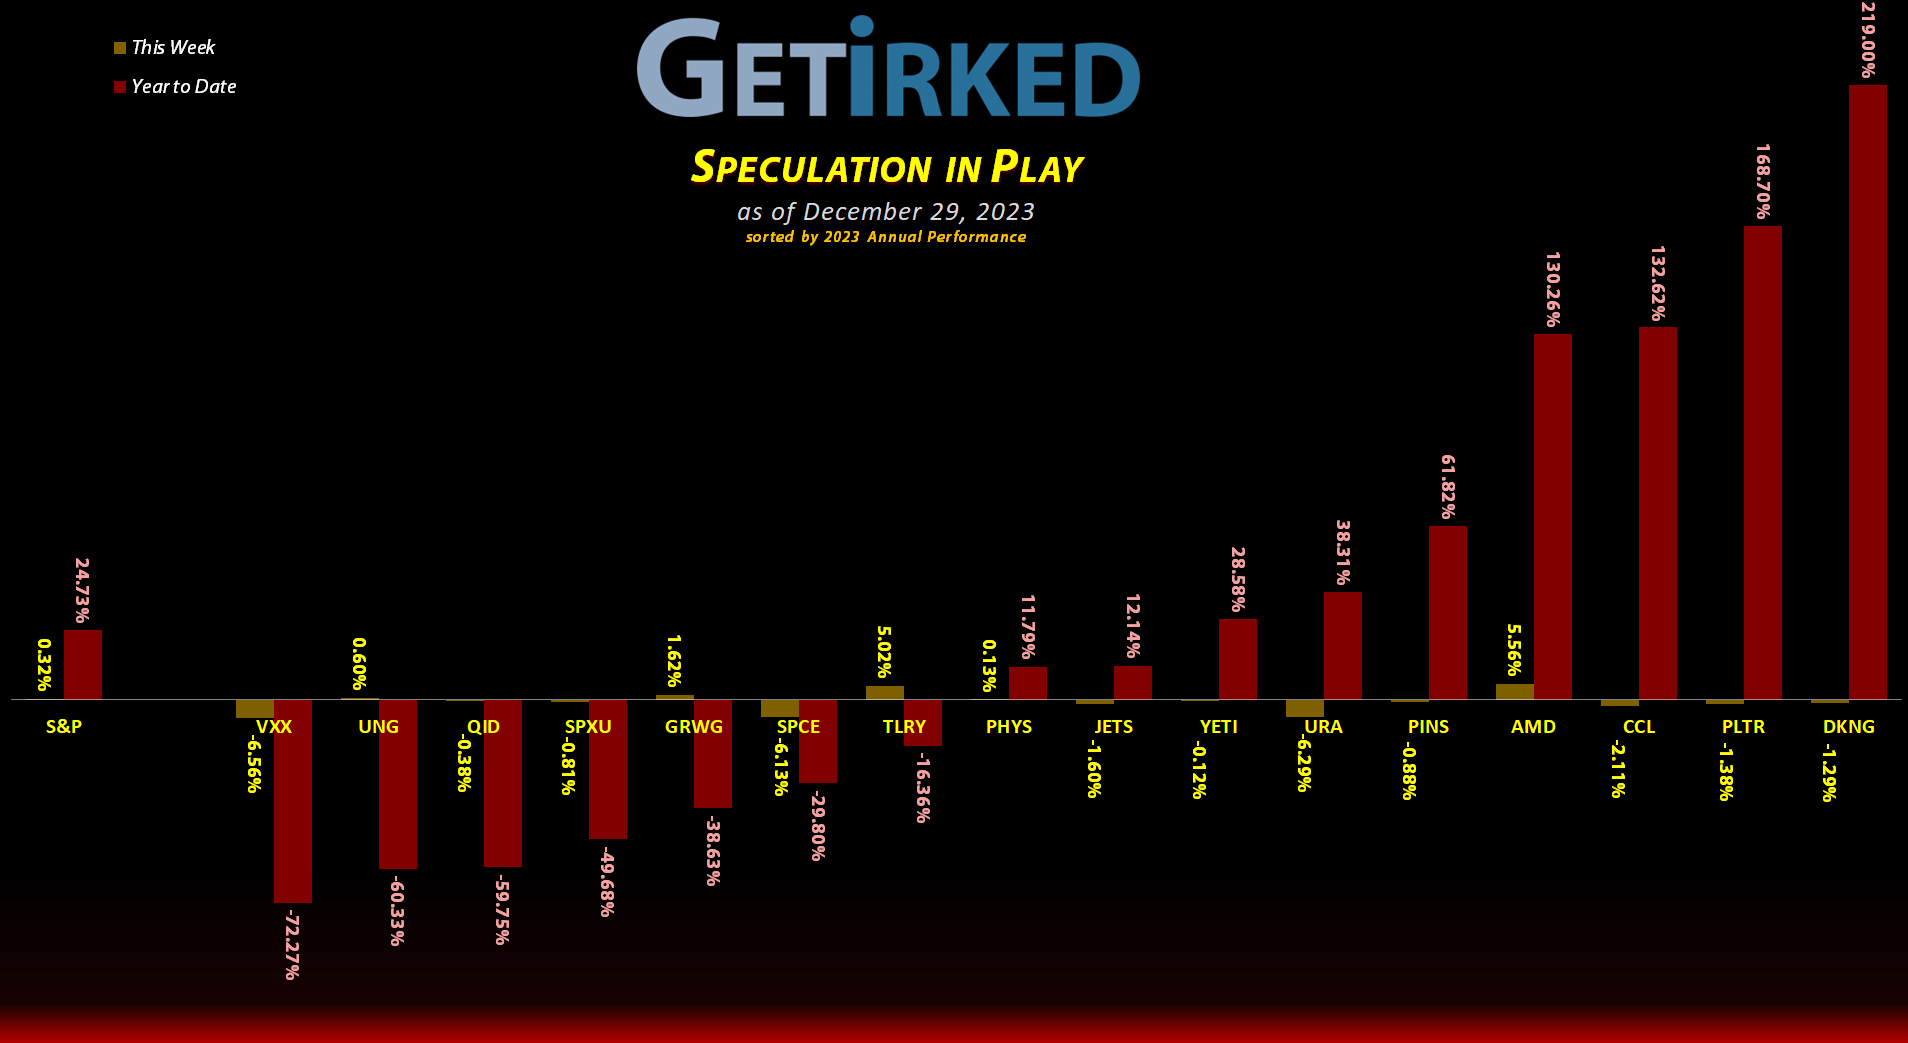
The end of a year is always a big milestone, so rather than cover the week’s biggest winner, I choose to look at the year’s biggest winner. Sports-betting giant DraftKings (DKNG) clocked in a whopping +219.00% gain this year, oustripping even the artificial intelligence darling Palantir Technologies (PLTR) for the top spot. An incredible gain, particularly given how beaten up DraftKings was coming into 2023.
U.S. Natural Gas (UNG)
As always, I choose to omit any investments that play a short or volatility instrument, so the year’s Biggest Loser is the U.S. Natural Gas Fund (UNG). UNG plumbed to all-new lows this year, finishing the year down an incredible -60.33% from where it started. This asset definitely earns its nickname of “The Widowmaker.” Yowtch!
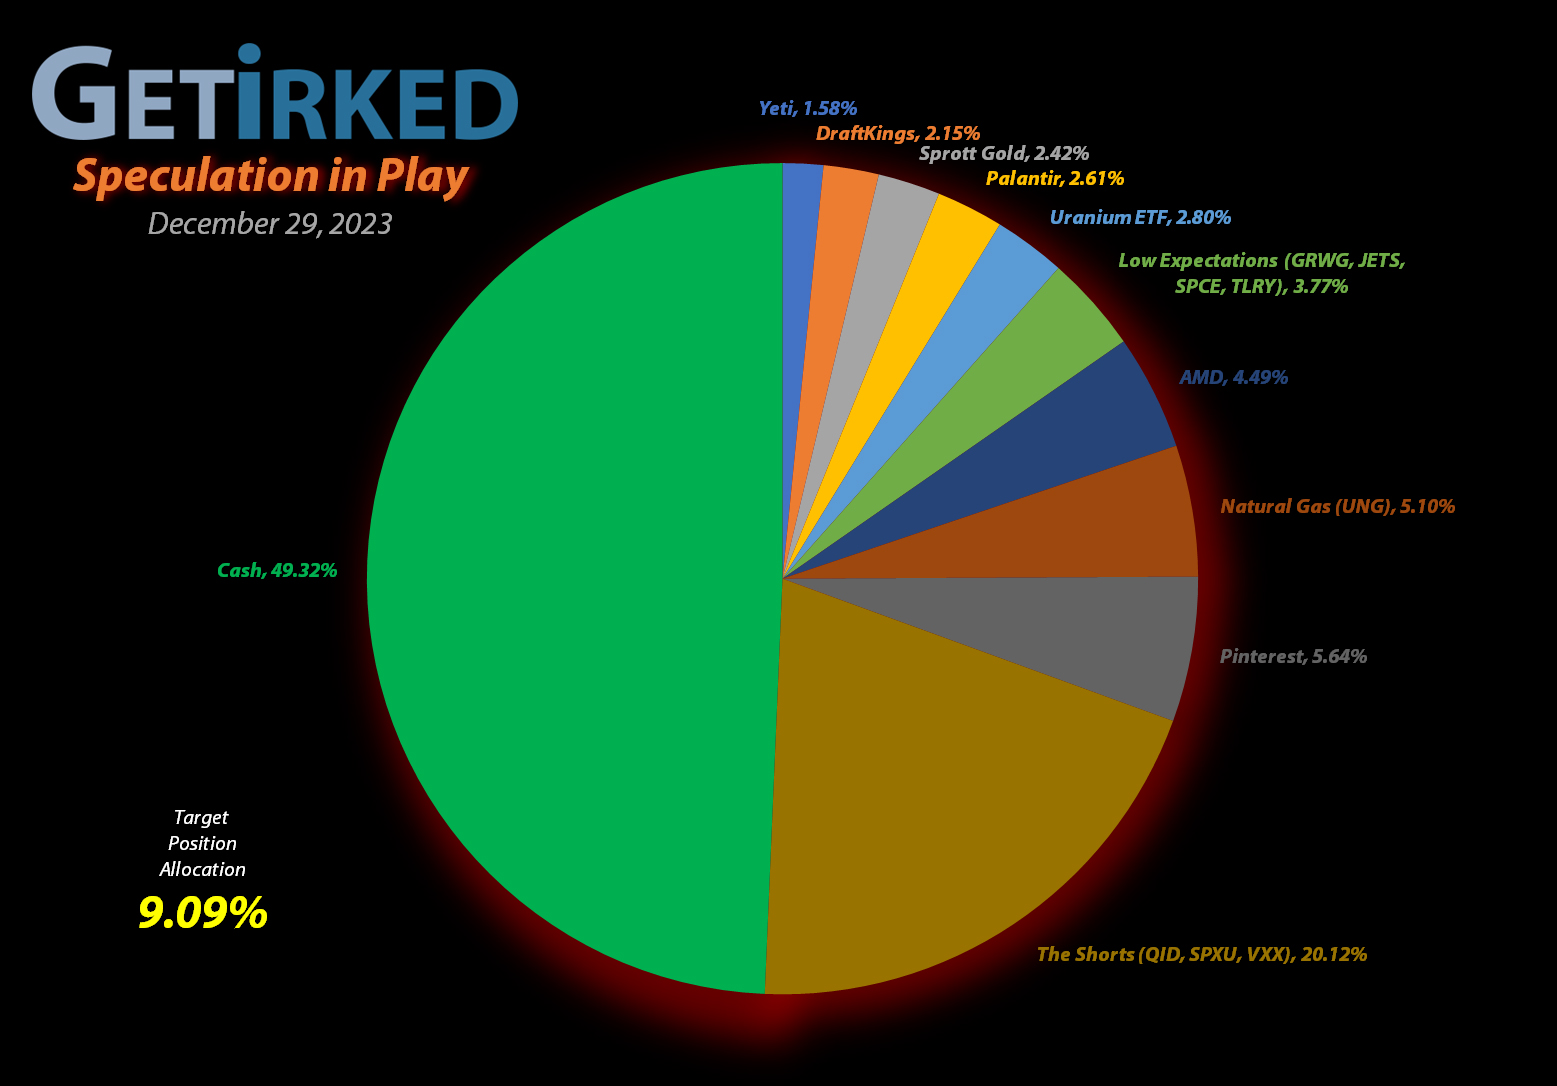
Portfolio Allocation
Positions
%
Target Position Size
Current Position Performance
AMD (AMD)
+721.75%*
1st Buy: 1/10/2019 @ $19.54
Current Per-Share: (-$135.01)*
Pinterest (PINS)
+440.39%*
1st Buy: 5/16/2019 @ $25.72
Current Per-Share: (-$29.14)*
Yeti (YETI)
+416.89%*
1st Buy: 2/26/2019 @ $23.23
Current Per-Share: (-$145.01)*
Uranium ETF (URA)
+133.51%
1st Buy: 2/23/2021 @ $17.97
Current Per-Share: $11.85
Virgin Galactic (SPCE)
+108.72%*
1st Buy: 10/31/2019 @ $9.87
Current Per-Share: (-$2.20)*
Airlines ETF (JETS)
+96.27%*
1st Buy: 5/14/2020 @ $11.30
Current Per-Share: (-$35.37)*
Carnival Cruise (CCL)
+80.53%
1st Buy: 3/12/2020 @ $17.25
Current Per-Share: -CLOSED-
Tilray Brands (TLRY)
+51.60%*
1st Buy: 9/21/2018 @ $128.97
Current Per-Share: (-$3.75)*
DraftKings (DKNG)
+23.66%
1st Buy: 1/29/2021 @ $52.97
Current Per-Share: $28.51
Palantir (PLTR)
+11.68%
1st Buy: 2/12/2021 @ $31.50
Current Per-Share: $15.37
Sprott Gold Trust (PHYS)
+8.97%
1st Buy: 6/5/2023 @ $15.25
Current Per-Share: $14.60
The “VIX” (VXX)
-17.67%
1st Buy: 11/2/2023 @ $21.75
Current Per-Share: $18.85
Short SPY (SPXU)
-18.14%
1st Buy: 3/9/2023 @ $14.75
Current Per-Share: $10.52
Short QQQ (QID)
-25.84%
1st Buy: 3/7/2023 @ $20.20
Current Per-Share: $14.30
U.S. Natural Gas (UNG)
-28.43%
1st Buy: 1/30/2023 @ $9.30
Current Per-Share: $7.15
Grow Gen (GRWG)
-81.48%
1st Buy: 10/30/2020 @ $16.04
Current Per-Share: $13.55
* Indicates a position where the capital investment was sold.
Profit % for * positions = Current Total Profit / Original Capital Investment
This Week’s Moves
Airlines ETF (JETS): Profit-Taking
The airlines have seen an absolutely epic rally off their lows in late-October/early-November, so I decided to lock in additional gains if we saw a pullback heading into the end of the year which we did on Friday. The drop triggered a stop-limit sell order I had in place which filled at $19.00, selling 50.00% of the remaining position and locking in +68.14% in gains on some of the shares I bought for $11.30 when I opened the position on May 14, 2020.
The sale lowered my per-share “cost” -$27.19 from -$8.19 to -$35.38 (a negative per-share cost indicates all capital has been removed in addition to $35.38 per share added to the portfolio’s bottom line in addition to each share’s current value).
From here, my next sell target is $21.13, under a point of resistance JETS saw early in 2023 and where I’ll close this position entirely. My next buy target is $14.77, slightly above the lows JETS saw less than two months ago.
Since I closed Carnival Cruise Lines (CCL) entirely this week – JETS’ compatriot in the “Recovery Spec” basket – I have now rolled JETS into the Low Expectations Basket where it will share a single allocation with GrowGeneration (GRWG), Tilray Brands (TLRY), and Virgin Galactic (SPCE).
JETS closed the week at $19.03, up +0.16% from where I took profits Friday.
Carnival Cruise Lines (CCL): Position Closed: +80.5%
Carnival Cruise Lines (CCL) almost survived the year but trailed off Friday just far enough to trigger my stop-limit sell order which closed the position entirely at $18.53, locking in lifetime gains of +80.50% since I initially opened the position on March 12, 2020 at $17.25 (an annualized gain of +28.41%/yr).
I decided that Carnival’s volatility had been enough and that it was time to close the position, mostly because I felt that CCL had run its course for me and it was time to move on to other ideas, but, also, partially because Carnival had rallied more than 80% in just two months.
This closes the book on Carnival but doesn’t necessarily mean I won’t ever try again. It just means I’m done for right now.
CCL closed the week at $18.54, up +$0.01 from where I closed it.
DraftKings (DKNG): Profit-Taking
DraftKings (DKNG) hasn’t been performing well ever since it made an attempt at its 2023 high and failed back in November. Despite the rest of the market exhibiting strength, DraftKings has floundered, even pulling back pretty significantly earlier in December.
Accordingly, I used a stop-limit sell order to take profits when DraftKings broke a support level on Friday, selling 33.33% of my position at $35.24. The sale lowered my per-share cost -7.28% from $30.75 to $28.51, but, more importantly, freed up capital which I will put to work at lower levels if we see a pull back in Q1-2024 as I expect we will.
From here, my next buy target is $20.54, above a key level of support as well as the 50% Fibonacci Retracement of DraftKings’ epic rally from its December 2022 low to its high in 2023. My next sell target is $64.01, just under a past point of resistance and the point at which I’ll remove the remaining capital from this position.
DKNG closed the week at $35.25, up +$0.01 from where I took profits Friday.
Nasdaq-100 Short ETF (QID): Dividend Payout
The ProShares UltraShort QQQ ETF (QID) – my inverse short position on the Nasdaq-100 – paid out its quarterly dividend on Thursday. Given the highly risky nature of a leveraged inverse-short ETF, I choose to take the dividend payout in cash rather than reinvesting it as I would in a normal long investment.
The payout lowered my per-share cost -1.38% from $14.50 to $14.30. From here, my next buy target is $10.39, a price calculated using Fibonacci Method which is rapidly approaching if the Nasdaq continues its rally in 2024, and my next sell target is $14.89 where I will substantially reduce the allocation in this position.
Palantir Technologies (PLTR): Profit-Taking
Seeing the weakness that Palantir Technologies (PLTR) has been demonstrating for several weeks now despite the rest of the market rallying higher made me employ a risk-management strategy of reducing my position if Palantir broke support which it did on Friday.
This selloff triggered my stop-limit sell order which filled at $17.31, selling 16.67% of the position and reducing my per-share cost -2.10% from $15.70 to $15.37. From here, my next selling target is $21.45, below a point of resistance Palantir saw back in November, and my next buy target is $11.65, above a point of support and a key Fibonacci Retracement level Palantir has seen in the past.
PLTR closed the week at $17.17, down -0.81% from where I took profits.
S&P 500 Short ETF (SPXU): Dividend Payout
The ProShares UltraPro Short S&P 500 ETF (SPXU) – my inverse short position on the S&P 500 index – paid out its quarterly dividend on Thursday. Given the highly risky nature of a leveraged inverse-short ETF, I choose to take the dividend payout in cash rather than reinvesting it as I would in a normal long investment.
The payout lowered my per-share cost -1.68% from $10.70 to $10.52. From here, my next buy target is $8.12, a price calculated using Fibonacci Method , and my next sell target is $10.86.
Yeti (YETI): Profit-Taking
If you’re not familiar with Yeti (YETI), the manufacturer of popular coolers, tumblers, and active lifestyle beverage equipment, you might think such a stock would be incredibly boring, not moving much over time.
You would be wrong. VERY wrong.
I started my position in Yeti back on February 26, 2019 at $23.23. Yeti rallied to a high of around $36.50 before dropping all the way down to $15.28 during the March 2020 pandemic selloff only to rocket to an all-time high of $108.82 in the summer of 2021.
Again… this company makes insulated drink tumblers. Crazy.
In 2022, Yeti collapsed all the way down to $27.86, a -74.40% selloff from its all-time high, but it has rallied +94.38% off its September 2022 lows. My timing has been very lucky with this stock, having pulled all of my investing capital out of it back in February 2020, right before the pandemic crash.
This is one of those positions that proves the adage “better lucky than good.” Since then, I’ve been managing my position, adding at lows and taking profits at points of resistance, and since the market has been rallying seemingly nonstop into the end of 2023, I decided to substantially trim my Yeti position.
YETI triggered my sell order on Wednesday, selling 50% of my remaining position at $53.41, locking in +113.47% in gains on shares I bought for $25.02 on March 1, 2019. The sale also lowered my per-share cost -$99.21 from -$45.80 to -$145.01 (a negative per-share cost indicates all capital has been removed in addition to $145.01 per share added to the portfolio’s bottom line in addition to each share’s current value).
From here, I will close the position entirely if it makes a run for its all-time high with my next sell target at $104.99, just under a repeated point of resistance (however, that’s so far from here, I’m not planning on a position closure any time soon). If the market rolls over in 2024 as I believe it might, I will replace some of the shares I sold if Yeti tests its November 2023 low with my next buy target at $37.51, just above its $37.28 low in November.
YETI closed the week at $51.78, down -3.05% from where I took profits.


