December 15, 2023
Risk Disclaimer
The positions in this portfolio are incredibly risky and extremely volatile.
No one at Get Irked is a professional financial adviser (or a doctor), so consult with your own financial adviser to see if any of these positions fit your risk profile (and stomach).
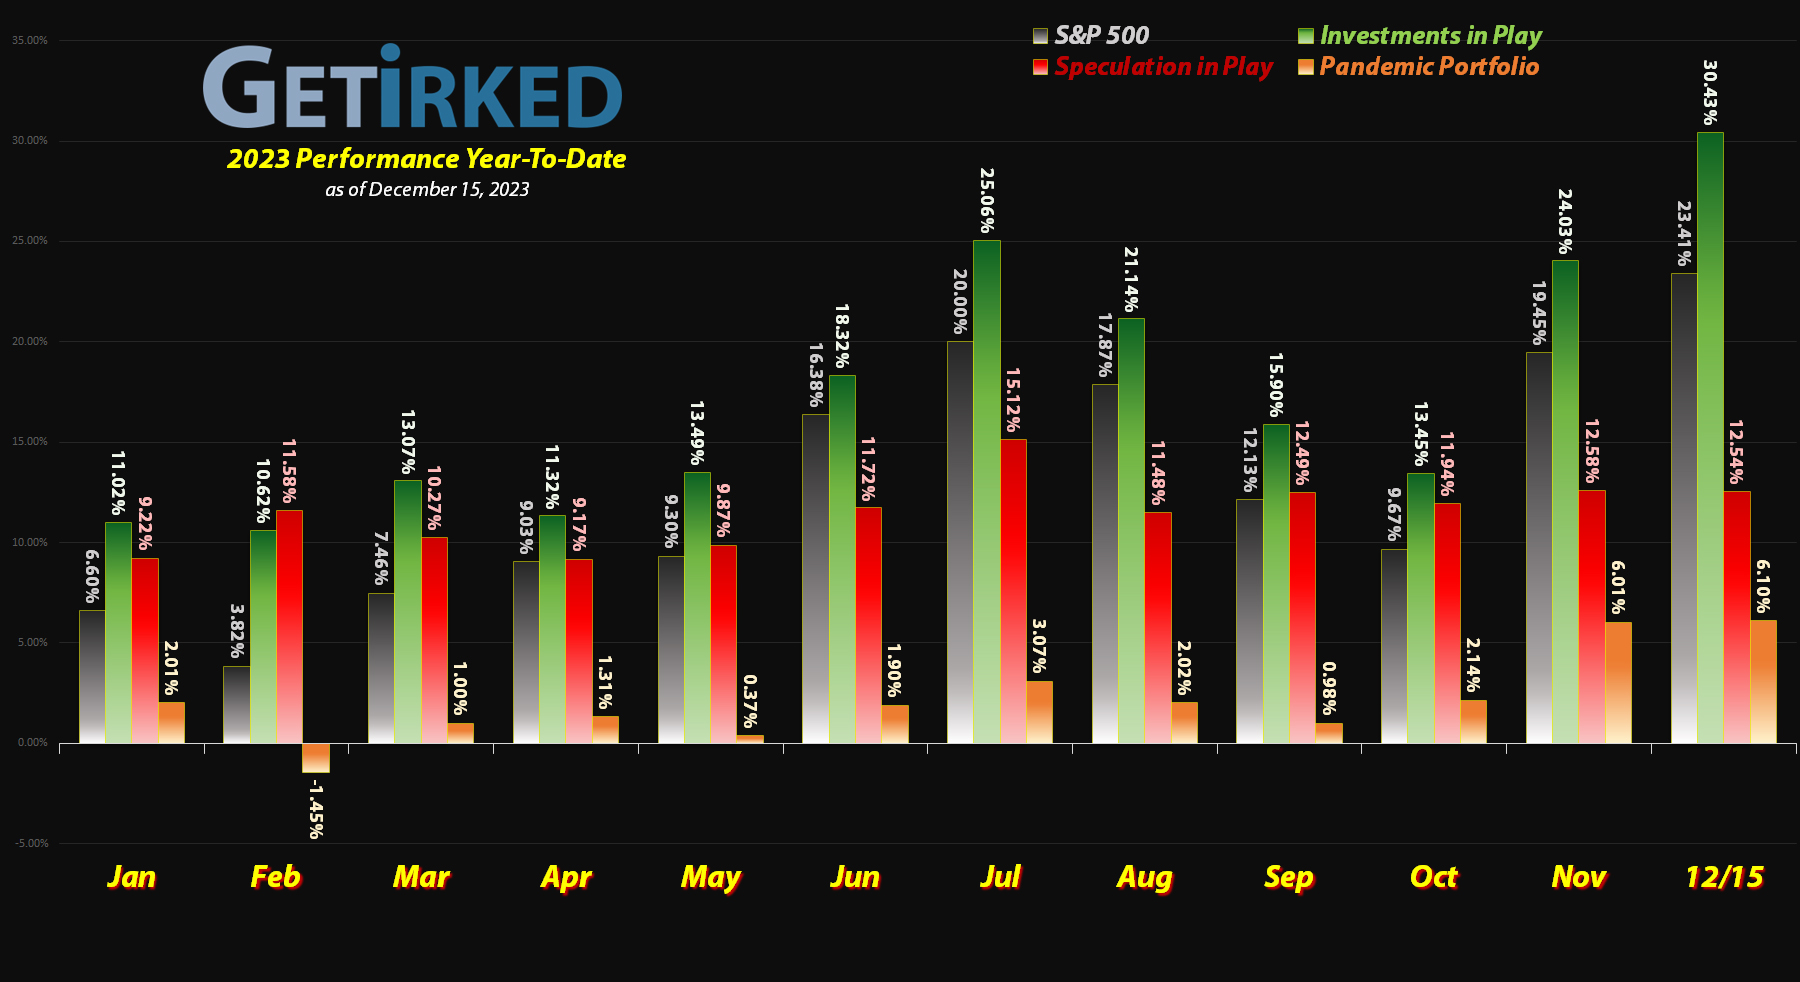
Click image to bring up larger version.
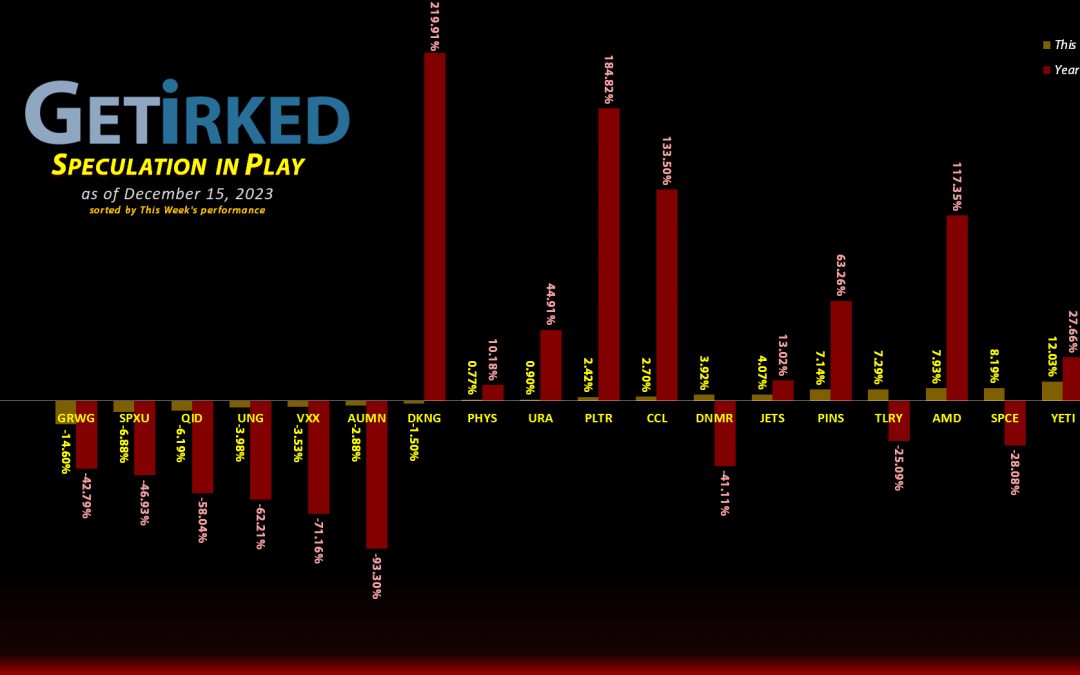
The Week’s Biggest Winner & Loser
Zillow (Z)
When Federal Reserve Chairman Jerome Powell announced that the Fed was basically done with the rate tightening cycle and would be cutting rates three times in 2024, the stocks of all companies with directly relationship to interest rates really took off.
Naturally, this means the real estate stocks exploded to the upside, and Zillow (Z) was no exception, rallying +20.28% to swing in as this Week’s Winner.
Below, I bid a fond farewell to this position. Read on to find out why!
GrowGeneration (GRWG)
The cannabis stocks dance to the beat of a different drummer and it certainly showed this week! When the rest of the market – particularly interest-rate sensitive sectors – rocketed higher, GrowGeneration (GRWG) and the rest of the cannabis collapsed. GRWG dropped a whopping -14.60% this week, easily swinging as the portfolio’s Biggest Loser.
Portfolio Allocation
Positions
%
Target Position Size
Current Position Performance
AMD (AMD)
+700.64%*
1st Buy: 1/10/2019 @ $19.54
Current Per-Share: (-$135.01)*
Pinterest (PINS)
+442.38%*
1st Buy: 5/16/2019 @ $25.72
Current Per-Share: (-$29.14)*
Yeti (YETI)
+412.20%*
1st Buy: 2/26/2019 @ $23.23
Current Per-Share: (-$45.80)*
Uranium ETF (URA)
+144.98%
1st Buy: 2/23/2021 @ $17.97
Current Per-Share: $11.85
Virgin Galactic (SPCE)
+110.13%*
1st Buy: 10/31/2019 @ $9.87
Current Per-Share: (-$2.20)*
Airlines ETF (JETS)
+96.82%*
1st Buy: 5/14/2020 @ $11.30
Current Per-Share: (-$8.19)*
Carnival Cruise (CCL)
+79.94%*
1st Buy: 3/12/2020 @ $17.25
Current Per-Share: (-$9.00)*
Tilray Brands (TLRY)
+49.51%*
1st Buy: 9/21/2018 @ $128.97
Current Per-Share: (-$3.75)*
Palantir (PLTR)
+15.85%
1st Buy: 2/12/2021 @ $31.50
Current Per-Share: $15.69
DraftKings (DKNG)
+14.96%
1st Buy: 1/29/2021 @ $52.97
Current Per-Share: $30.75
Sprott Gold Trust (PHYS)
+7.53%
1st Buy: 6/5/2023 @ $15.25
Current Per-Share: $14.60
Zillow (Z)
+6.31%
1st Buy: 11/18/2021 @ $57.13
Current Per-Share: **CLOSED**
The “VIX” (VXX)
-14.38%
1st Buy: 11/2/2023 @ $21.75
Current Per-Share: $18.85
Short SPY (SPXU)
-15.14%
1st Buy: 3/9/2023 @ $14.75
Current Per-Share: $10.70
Short QQQ (QID)
-23.65%
1st Buy: 3/7/2023 @ $20.20
Current Per-Share: $14.50
U.S. Natural Gas (UNG)
-31.88%
1st Buy: 1/30/2023 @ $9.30
Current Per-Share: $7.15
Grow Gen (GRWG)
-82.73%
1st Buy: 10/30/2020 @ $16.04
Current Per-Share: $13.55
Danimer Sci (DNMR)
-86.67%
1st Buy: 10/20/2021 @ $15.00
Current Per-Share: $7.95
Golden Mine. (AUMN)
-91.97%
1st Buy: 7/29/2021 @ $13.29
Current Per-Share: $6.37
* Indicates a position where the capital investment was sold.
Profit % for * positions = Current Total Profit / Original Capital Investment
This Week’s Moves
Natural Gas Fund (UNG): Added to Position
Oil continued to sell off to start the week, causing further weakness in natural gas, which naturally (pun intended) caused my U.S. Natural Gas Fund (UNG) position to float through my next buy order which filled at $4.58, adding 5.85% to the position and lowering my per-share cost -3.40% from $7.35 to $7.10.
From here, my next buy target is $3.52, a price calculated using the Fibonacci Method, and my next sell target is $7.18, just below a key point of resistance from the past few months.
UNG closed the week at $4.83, up +5.46% from where I added Monday.
Short Nasdaq-100 ETF (QID): Added to Position x2
When stocks rallied after Tuesday’s CPI report, the Nasdaq-100 rose high enough to trigger the next buy order in my inverse leveraged short play, the ProShares UltraShort QQQ ETF (QID), which added 5.90% to the position at $11.50.
The higher stocks continue to rally into the end of the year, the more I believe we’ll see a significant drawdown in January and February of 2024 as firms lock in the spectacular gains we’ve seen in 2023. Since this is my speculative portfolio, I will continue adding to my short positions.
The Speculation in Play portfolio is 1/2 of an allocation of my Investments in Play – it is that small – and since I’m long in the rest of my portfolio, I like to have this relatively tiny portfolio take up the other side of the trade. The buy order lowered my per-share cost -1.67% from $15.00 to $14.75.
When the markets rocketed higher on Thursday, my next buy order was triggered, adding another 5.33% at $11.00 and giving me an average buying price of $11.25. The second buy lowered my per-share cost another -1.69% from $14.75 to $14.50 and a total -3.33% reduction to my position’s cost basis from where it started the week.
From here, my next buy target is $10.50, another psychological support and my next sell target is $14.90, under a past point of resistance.
QID closed the week at $11.06, down -1.69% from my $11.25 average buy.
Short S&P 500 ETF (SPXU): Added to Position
After the Federal Reserve meeting caused stocks to explode higher on Wednesday, the price action caused my next buy order to fill in my ProShares UltraPro Short S&P 500 ETF (SPXU) position, adding 8.00% at $9.35.
The buy lowered my per-share cost -1.38% from $10.85 to $10.70. From here, my next buy target is $8.50, a bit lower than the next Fibonacci Retracement level, and my next sell target is $10.99, below a key level of resistance.
SPXU closed the week at $9.07, down -2.99% from where I added Wednesday.
The “VIX” Volatility Index (VXX): Added to Position x2
The Volatility Index (VIX), also called the “Fear Index,” has dropped to lows below where it was prior to the COVID-19 pandemic sell off in 2020. As I do believe we’ll see volatility in the next 2-3 months, I am continuing to build my position in the iPath S&P 500 VIX Short-Term ETN (VXX).
I know going long the VIX is a sucker’s game which is why I am only playing this position in my speculative account and only risking money I can afford to lose entirely; it’s highly likely this trade’s going to go to zero.
On Monday, my next buy order filled at $16.45, adding 7.03% to my position and lowered my per-share cost -1.54% from $19.45 to $19.15. From here, my next buy target is $15.85, a price calculated using the Fibonacci Method, and my next sell target is $20.95 under both a key level of resistance as well as a Fibonacci Retracement Level.
On Tuesday, the VIX crush continued with VXX falling through my next buy order, adding 6.80% to the position at $15.85 giving me a $16.15 average buy price. This buy lowered my per-share cost another -1.57% from $19.15 to $18.85, a total reduction of -3.08%.
From here, my next buy target is $15.25, a price calculated using a variety of factors including the Fibonacci Method, and my next sell target is $19.35, below a a past point of resistance.
VXX closed the week at $16.14, down -$0.01 from my $16.15 average buy price.
Zillow (Z): *Position Closed: +6.31%*
Zillow’s (Z) been an incredibly volatile stock in the two years that I’ve held it, so when the little bugger finished rallying nearly +66% off its November lows (yes, +65.83% in a month and a half!) on Thursday, I decided it was time to close the position entirely.
Additionally, given the amount of volatility in the stock, the amount of volatility in the real estate market, the number of unknowns in 2024, and the looming Commercial Real Estate crisis (yes, this one is still out there), I decided I’d rather free up the capital for the rest of the portfolio.
My sell order filled at $54.69 on Friday, closing out the position with a fairly middling +6.31% lifetime gain (+3.16% annualized).
Z closed the week at $55.80, up +2.03% from where I closed the position.


