December 1, 2023
Risk Disclaimer
The positions in this portfolio are incredibly risky and extremely volatile.
No one at Get Irked is a professional financial adviser (or a doctor), so consult with your own financial adviser to see if any of these positions fit your risk profile (and stomach).

Click image to bring up larger version.
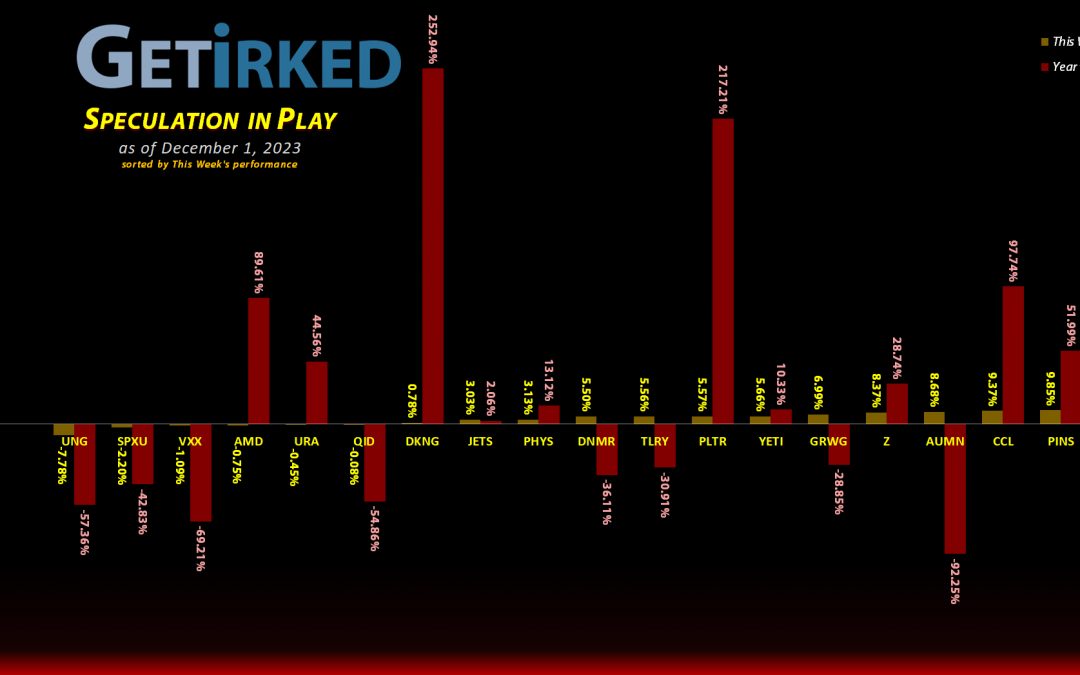
The Week's Biggest Winner & Loser
Virgin Galactic (SPCE)
When stocks drop below $5/shr, strange things can happen. Case in point: Virgin Galactic (SPCE) rocketed +11.96% on the back of... well... nothing. That's right. I can't find any news that caused the stock to pop outside of the fact that it cost around $2.00 at the start of the week.
Regardless, a win is a win, so that makes Virgin Galactic this week's Biggest Winner.
Natural Gas Fund (UNG)
With OPEC floundering and oil prices plummeting, all fossil fuels pulled back this week which caused the U.S. Natural Gas Fund (UNG) to drop -7.78%. Natural gas needs to find a bottom soon or else it runs the risk of going negative like oil did in May 2020 (not really, but free natural gas? Why not?)
As a result of its drop, UNG swung in as the week's biggest loser.
Portfolio Allocation
Positions
%
Target Position Size

Click image to bring up larger version.
Portfolio Breakdown

Click image to bring up larger version.
Year-to-Date Performance
Current Position Performance
Airlines ETF (JETS)
+1823.88%
1st Buy: 5/14/2020 @ $11.30
Current Per-Share: $0.90
AMD (AMD)
+655.25%*
1st Buy: 1/10/2019 @ $19.54
Current Per-Share: (-$135.01)*
Pinterest (PINS)
+425.35%*
1st Buy: 5/16/2019 @ $25.72
Current Per-Share: (-$29.14)*
Yeti (YETI)
+382.16%*
1st Buy: 2/26/2019 @ $23.23
Current Per-Share: (-$45.80)*
Uranium ETF (URA)
+144.14%
1st Buy: 2/23/2021 @ $17.97
Current Per-Share: $11.85
Virgin Galactic (SPCE)
+106.38%*
1st Buy: 10/31/2019 @ $9.87
Current Per-Share: (-$2.20)*
Carnival Cruise (CCL)
+69.41%*
1st Buy: 3/12/2020 @ $17.25
Current Per-Share: (-$0.21)*
Tilray Brands (TLRY)
+48.19%*
1st Buy: 9/21/2018 @ $128.97
Current Per-Share: (-$3.75)*
Palantir (PLTR)
+29.19%
1st Buy: 2/12/2021 @ $31.50
Current Per-Share: $15.69
DraftKings (DKNG)
+26.83%
1st Buy: 1/29/2021 @ $52.97
Current Per-Share: $30.75
Sprott Gold Trust (PHYS)
+10.41%
1st Buy: 6/5/2023 @ $15.25
Current Per-Share: $14.60
Zillow (Z)
-9.08%
1st Buy: 11/18/2021 @ $57.13
Current Per-Share: $47.69
Short SPY (SPXU)
-9.82`%
1st Buy: 3/9/2023 @ $14.75
Current Per-Share: $10.85
The "VIX" (VXX)
-11.41%
1st Buy: 11/2/2023 @ $21.75
Current Per-Share: $19.45
Short QQQ (QID)
-20.66%
1st Buy: 3/7/2023 @ $20.20
Current Per-Share: $15.00
U.S. Natural Gas (UNG)
-27.20%
1st Buy: 1/30/2023 @ $9.30
Current Per-Share: $7.50
Grow Gen. (GRWG)
-78.52%
1st Buy: 10/30/2020 @ $16.04
Current Per-Share: $13.55
Danimer Sci (DNMR)
-85.53%
1st Buy: 10/20/2021 @ $15.00
Current Per-Share: $7.95
Golden Mine. (AUMN)
-91.00%
1st Buy: 7/29/2021 @ $13.29
Current Per-Share: $6.37
* Indicates a position where the capital investment was sold.
Profit % for * positions = Current Total Profit / Original Capital Investment
This Week’s Moves
Danimer Scientific (DNMR): Added to Position
Despite being last week's Biggest Loser, Danimer Scientific (DNMR) came out of the gate down once more Monday morning, triggering my next buy order which added 0.90% to my position at $1.05. The buy lowered my per-share cost -3.64% from $8.25 to $7.95. While it may seem like I'm throwing good money after bad into this mess, I've reduced the quantities to such small amounts that I'm basically making a "Hail Mary" pass at this garbage stock.
I do have another buy order own at $0.41, a price calculated using the Fibonacci Method, and my sell target is $4.50, below its 2023 high and below my cost basis, however, if DNMR sees a miraculous rally like it did earlier this year, it would certainly be prudent to take profits since that run would represent a 4X from where I bought on Monday.
DNMR closed the week at $1.15, up +9.52% from where I added Monday.
DraftKings (DKNG): Profit-Taking
After rallying to new year-to-date highs around $39 last week, DraftKings (DKNG) was seeing significant resistance at that price point for days. On Monday, I felt the prudent thing to do would be to take profits, so I sold 25.00% of my allocation with a sale order which filled at $39.08.
The buy locked in +25.86% in gains on shares I bought for $31.05 back on December 2, 2021 and lowered my per-share cost -6.36% from $32.84 to $30.75. From here, my next buy target is $23.15, above a point of support DKNG saw earlier in 2023, and my next sell target is $52.25, just under a point of resistance DraftKings saw in 2021.
DKNG closed the week at $39.00, down -0.20% from where I took profits Monday.
Natural Gas (UNG): Added to Position
Natural gas sold off on Tuesday after weather forecasts showed mild weather extending further into the winter. My U.S. Natural Gas Fund (UNG) position triggered my next buy order which filled at $5.55, adding 4.75% to my allocation and lowering my per-share cost -1.96% from $7.65 to $7.50.
To some, my ongoing trade in the natural gas space may seem like a fool's errand between its never-ending slide and the built-in contango that works against anyone dumb enough to trade this space, but I believe something big is coming... something no one expects.
That being said, I'm also substantially managing my risk. In addition to playing this trade in my Speculation in Play Portfolio (which is less than a full allocation size of my Investments in Play portfolio), I'm also limiting the amount I can lose in this trade.
That being said, my next buy price target is $5.25, a price calculated using the Fibonacci Method, and my next sell target is $7.80, substantially below a past point of resistance.
UNG closed the week at $5.46, down -1.62% from where I added Tuesday.
The "VIX" Volatility Index (VXX): Added to Position x2
The market's complacency continued this week with the VIX plumbing new depths. Accordingly, the Barclays S&P 500 VIX Short Term Futures ETN (VXX) dropped in tandem, triggering my next buy order which filled at $17.30 on Tuesday and added 7.42% to my position.
Now, it may seem like I'm throwing good money after bad in this trade, but, historically, whenever the VIX hits new lows, it almost always precedes an incredible spike resulting from a Black Swan Event, a credit event, a recession, or some other economic catastrophe.
Since the thesis of my trade is that I believe we're due for a VIX spike sometime between now and the start of February 2024, I will continue adding small quantities to the position if VIX gets weaker and weaker.
The buy lowered my per-share cost -1.74% from $20.10 to $19.75. Then, on Friday, the VIX continued to get crushed, triggering my next buy order which fille at $17.05, adding 7.22% to the allocation, giving me an average buy price of $17.18. This buy lowered my per-share cost an additional -1.54% from $19.75 to $19.45, a total reduction of -3.23% from the start of the week.
From here, my next buy target is $16.45, a price calculated using the Fibonacci Method, and my next sell target is $24.25, just below a key point of resistance.
VXX closed the week at $17.23, up +0.29% from my $17.18 average buy.
Short S&P 500 ETF (SPXU): Added to Position
The "immaculate rally" continued in the markets this week, causing the ProShares UltraPro Short S&P 500 ETF (SPXU) to trigger my next buy order which added 12.64% to my position at $9.85 on Wednesday. The buy lowered my per-share cost 1.81% from $11.05 to $10.85.
It's important to remember that I am only trying short strategies and other high-risk plays in my Speculation in Play account; the entire portfolio is just 4% of the size of my Investments in Play portfolio and it's still more than 40% cash. These are tiny positions where I am prepared to lose every dollar I risk.
In other words, they're just for fun.
From here, my next buy target is $9.10, slightly above the psychological "round-number" support of $9.00, and my next sell target is $11.70, near a past point of resistance.
SPXU closed the week at $9.79, down -0.61% from where I added Wednesday.
Uranium ETF (URA): Profit-Taking
There are rallies and then there are RALLIES. Uranium has been in the latter category for almost the entirety of 2023, and this week it appeared as though the Global X Uranium ETF (URA) had met its match just under $30, selling off nearly -4% on Wednesday alone.
So, when the ETF recovered all of its losses and then some on Thursday, I decided it was time to lock in some profits, selling 23.12% of my position at $28.98. The sale locked in +56.82% in gains on shares I bought for $18.48 back on August 16, 2021 and lowered my per-share cost -25.05% from $15.81 to $11.85.
Since my position is quite a bit smaller than I'd prefer, I'm holding off taking more profits unless the ETF reaches much higher levels with my next selling price target at $49.53, just under a past point of resistance.
I do still believe in the long-term prospects for nuclear energy and, therefore, uranium, so I will start adding quite quickly above my cost basis with my next buy target at $20.50, slightly above the low the Uranium ETF saw in July.
URA closed the week at $28.93, down -0.17% from where I took profits Thursday.