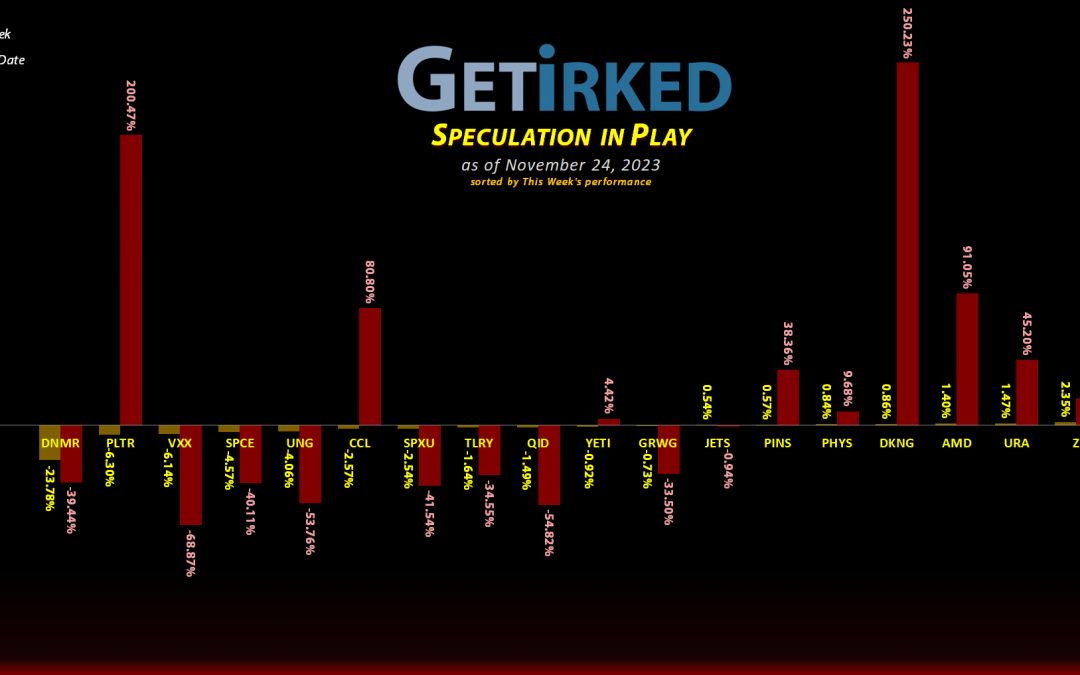
November 24, 2023
Risk Disclaimer
The positions in this portfolio are incredibly risky and extremely volatile.
No one at Get Irked is a professional financial adviser (or a doctor), so consult with your own financial adviser to see if any of these positions fit your risk profile (and stomach).

Click image to bring up larger version.
The Week's Biggest Winner & Loser
Golden Minerals (AUMN)
Ah, good ol' Golden Minerals (AUMN), my super-speculative penny-stock junior gold miner. This one has been a terrible stock, but, as they say, a rising tide lifts all boats, so when the precious yellow metal saw a pop this week, so did Golden Minerals. AUMN ended up getting a +5.32% rally off the move, letting this turd shine for the week as the Biggest Winner in the portfolio (until next week where it will likely be the Biggest Loser, once more).
Danimer Scientific (DNMR)
Speaking of terrible investments, enter Danimer Scientific (DNMR). I keep this position as a reminder and reinforcement to the rule: Never take a stock tip from someone else.
Believe it or not, Danimer was recommended by an analyst for renowned research firm, Stansberry Research, as his single long-term pick back when I opened it the same day on 10/20/2021.
Since that point, Danimer has done everything wrong, stopping just short of admitting to outright fraud. It's garbage. However, I do not cut losses, so Danimer will either head higher or go to zero, a fateful reminder for me to always do my own due diligence and ignore others, no matter how respected they may be.
DNMR plunged another -23.78% this week, easily earning the spot of the portfolio's Biggest Loser.
Portfolio Allocation
Positions
%
Target Position Size

Click image to bring up larger version.
Portfolio Breakdown

Click image to bring up larger version.
Year-to-Date Performance
Current Position Performance
Airlines ETF (JETS)
+1768.31%
1st Buy: 5/14/2020 @ $11.30
Current Per-Share: $0.90
AMD (AMD)
+657.27%*
1st Buy: 1/10/2019 @ $19.54
Current Per-Share: (-$135.01)*
Pinterest (PINS)
+404.59%*
1st Buy: 5/16/2019 @ $25.72
Current Per-Share: (-$29.14)*
Yeti (YETI)
+372.17%*
1st Buy: 2/26/2019 @ $23.23
Current Per-Share: (-$45.80)*
Virgin Galactic (SPCE)
+100.65%*
1st Buy: 10/31/2019 @ $9.87
Current Per-Share: (-$2.20)*
Uranium ETF (URA)
+83.87%
1st Buy: 2/23/2021 @ $17.97
Current Per-Share: $15.81
Carnival Cruise (CCL)
+63.54%*
1st Buy: 3/12/2020 @ $17.25
Current Per-Share: (-$0.21)*
Tilray Brands (TLRY)
+47.34%*
1st Buy: 9/21/2018 @ $128.97
Current Per-Share: (-$3.75)*
Palantir (PLTR)
+22.34%
1st Buy: 2/12/2021 @ $31.50
Current Per-Share: $15.69
DraftKings (DKNG)
+17.87%
1st Buy: 1/29/2021 @ $52.97
Current Per-Share: $32.84
Sprott Gold Trust (PHYS)
+7.05%
1st Buy: 6/5/2023 @ $15.25
Current Per-Share: $14.60
Short SPY (SPXU)
-9.59`%
1st Buy: 3/9/2023 @ $14.75
Current Per-Share: $11.05
The "VIX" (VXX)
-13.33%
1st Buy: 11/2/2023 @ $21.75
Current Per-Share: $20.10
Zillow (Z)
-16.10%
1st Buy: 11/18/2021 @ $57.13
Current Per-Share: $47.69
Short QQQ (QID)
-20.60%
1st Buy: 3/7/2023 @ $20.20
Current Per-Share: $15.00
U.S. Natural Gas (UNG)
-22.88%
1st Buy: 1/30/2023 @ $9.30
Current Per-Share: $7.65
Grow Gen. (GRWG)
-79.93%
1st Buy: 10/30/2020 @ $16.04
Current Per-Share: $13.55
Danimer Sci (DNMR)
-86.85%
1st Buy: 10/20/2021 @ $15.00
Current Per-Share: $8.25
Golden Mine. (AUMN)
-91.88%
1st Buy: 7/29/2021 @ $13.29
Current Per-Share: $6.37
* Indicates a position where the capital investment was sold.
Profit % for * positions = Current Total Profit / Original Capital Investment
This Week’s Moves
Short Nasdaq-100 ETF (QID): Added to Position
Technology stocks continued to be the darling of the markets at the start of the week, causing the Nasdaq-100 (QQQ) to rally which, naturally, pushed my ProShares UltraShort QQQ ETF (QID) position through my next buy target which added 6.45% to the position at $11.82 on Monday.
The buy lowered my per-share cost -1.77% from $15.27 to $15.00. From here, my next buy target is $10.80, a price calculated using the Fibonacci Method, and my next sell target is $15.17, under a point of resistance QID saw in its most recent rally.
QID closed the week at $11.91, up +0.76% from where I added Monday.
Natural Gas Fund (UNG): Added to Position
When oil prices started to sell off with vigor on Wednesday, natural gas followed, causing the U.S. Natural Gas Fund (UNG) to plumb new lows, triggering my next buy order which added 5.03% to my position at $5.86.
The buy lowered my per-share cost -1.92% from $7.80 to $7.65. From here, my next buy order is $5.23, a price calculated using the Fibonacci Method, and my next sell order is $7.82, below a past point of resistance.
UNG closed the week at $5.90, up +0.68% from where I added Wednesday.
Short S&P 500 ETF (SPXU): Added to Position
When the markets continued edging higher this week, the upward momentum triggered my next buy order in my ProShares UltraPro Short S&P 500 ETF (SPXU) which filled at $10.20 on Monday, adding 8.61% to the position, and locking in an -18.40% discount replacing shares I sold for $12.50 on October 20..
The buy lowered my per-share cost -1.25%, down from $11.19 to $11.05. From here, my next buy target is $9.77, slightly above the low SPXU saw in August, and my next sell target is $12.45, slightly below a point of resistance SPXU has encountered in the past.
SPXU closed the week at $9.99, down -2.06% from where I added Monday.
The "VIX" Volatility Index (VXX): Added to Position x2
Heading into the shortened holiday week, volatility continued to slough off the market on Monday, sending the Volatility Index (VIX) to all-new lows and triggering my next buy in Barclays' S&P 500 VIX Futures ETF (VXX) which filled at $18.45 and added 7.79% to my position.
On Friday, VXX broke through to new all-time lows, triggering my next buy order which filled at $17.75, giving me an average buy price of $18.10, adding another 7.57% to my allocation, and lowering my per-share cost
The buy lowered my per-share cost -3.82% from $20.90 to $20.10. From here, my next buy target is $16.90 and my next sell target is $22.50.
VXX closed the week at $17.42, down -3.76% from my $18.10 average buy.