September 15, 2023
Risk Disclaimer
The positions in this portfolio are incredibly risky and extremely volatile.
No one at Get Irked is a professional financial adviser (or a doctor), so consult with your own financial adviser to see if any of these positions fit your risk profile (and stomach).

Click image to bring up larger version.
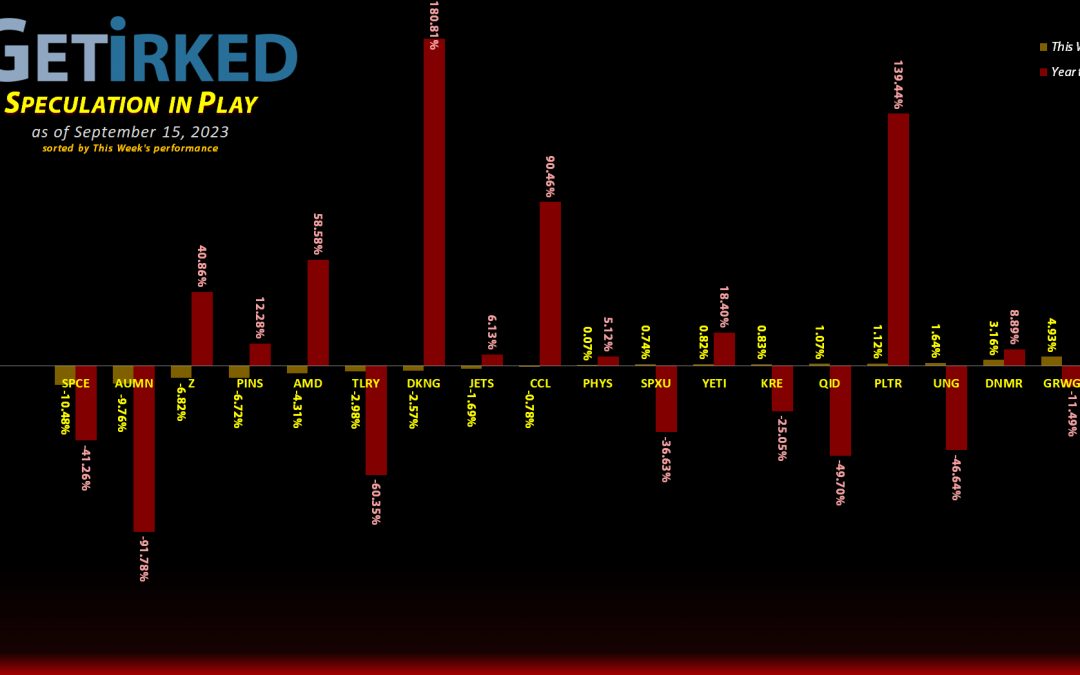
The Week's Biggest Winner & Loser
Uranium ETF (URA)
With many of the world's governments finally acknowledging that nuclear energy may be the only way to transition to a future of green energy, uranium rocketed to a record high price this week.
Naturally, all the companies associated with the precious "yellow cake" also saw a pop in their stocks, causing the Uranium ETF (URA) to radiate higher, gaining +9.06% and becoming the Week's Biggest Winner.
Virgin Galactic (SPCE)
Virgin Galactic's (SPCE) seemingly never-ending tailspin continued this week with the stock plummeting an additional -10.48%, a total collapse of -41.26% Year-to-Date.
This drop easily won SPCE the spot of the Week's Biggest Loser, but there's no end in sight for its crash-landing, so stay tuned to see if it's next week's Biggest Loser, too.
Portfolio Allocation
Positions
%
Target Position Size

Click image to bring up larger version.
Portfolio Breakdown

Click image to bring up larger version.
Year-to-Date Performance
Current Position Performance
AMD (AMD)
+604.40%*
1st Buy: 1/10/2019 @ $19.54
Current Per-Share: (-$135.01)*
Yeti (YETI)
+396.02%*
1st Buy: 2/26/2019 @ $23.23
Current Per-Share: (-$45.80)*
Pinterest (PINS)
+364.94%*
1st Buy: 5/16/2019 @ $25.72
Current Per-Share: -($29.14)*
Virgin Galactic (SPCE)
+99.48%*
1st Buy: 10/31/2019 @ $9.87
Current Per-Share: (-$2.20)*
Airlines ETF (JETS)
+86.23%*
1st Buy: 5/14/2020 @ $11.30
Current Per-Share: (-$29.12)*
Uranium ETF (URA)
+68.88%
1st Buy: 2/23/2021 @ $17.97
Current Per-Share: $15.81
Carnival Cruise (CCL)
+66.93%*
1st Buy: 3/12/2020 @ $17.25
Current Per-Share: (-$0.21)*
Tilray Brands (TLRY)
+53.07%*
1st Buy: 9/21/2018 @ $128.97
Current Per-Share: -($10.76)*
Regional Banks ETF (KRE)
+10.71%
1st Buy: 3/13/2023 @ $44.17
Current Per-Share: $39.49
Sprott Gold Trust (PHYS)
+0.63%
1st Buy: 6/5/2023 @ $15.25
Current Per-Share: $14.89
Zillow (Z)
-0.55%
1st Buy: 11/18/2021 @ $57.13
Current Per-Share: $47.69
Palantir (PLTR)
-4.78%
1st Buy: 2/12/2021 @ $31.50
Current Per-Share: $16.10
DraftKings (DKNG)
-6.09%
1st Buy: 1/29/2021 @ $52.97
Current Per-Share: $33.06
Short SPY (SPXU)
-11.67`%
1st Buy: 3/9/2023 @ $14.75
Current Per-Share: $12.25
Short QQQ (QID)
-16.87%
1st Buy: 3/7/2023 @ $20.20
Current Per-Share: $15.95
U.S. Natural Gas (UNG)
-17.45%
1st Buy: 1/30/2023 @ $9.30
Current Per-Share: $8.25
Canadian Pal (DCNNF)
-57.75%
1st Buy: 7/19/2021 @ $0.1000
Current Per-Share: $0.0691
Grow Gen. (GRWG)
-75.70%
1st Buy: 10/30/2020 @ $16.04
Current Per-Share: $14.90
Danimer Sci (DNMR)
-77.08%
1st Buy: 10/20/2021 @ $15.00
Current Per-Share: $8.55
Golden Mine. (AUMN)
-90.65%
1st Buy: 7/29/2021 @ $13.29
Current Per-Share: $6.37
Fabled Gold (FBSGF)
-96.69%
1st Buy: 7/23/2021 @ $0.5180
Current Per-Share: $0.4135
* Indicates a position where the capital investment was sold.
Profit % for * positions = Current Total Profit / Original Capital Investment
This Week’s Moves
Uranium ETF (URA): Profit-Taking
The Uranium ETF (URA) has been on a positive tear for several weeks now, and, while I do still believe in the long-term prospects of the sector, I believe this run will absolutely correct soon so I decided it was time to trim some of my position with a sell order that went through on Wednesday at $25.66, locking in +12.94% in gains on shares I bought for $22.72 back on December 14, 2021.
I sold 18.78% of my position and lowered my per-share cost -10.48% from $17.66 down to $15.81. From here, my next buy target is $19.21, slightly above the low URA saw in May 2023, and my next sell target is $31.48, slightly below the high URA saw in 2021.
URA closed the week at $26.70, up +4.05% from where I took profits Wednesday.
Virgin Galactic (SPCE): Added to Position
Virgin Galactic (SPCE) crashed down significantly over the past week and eventually triggered my next buy order on Tuesday which filled at $2.00. The adds 8.33% to my position and locked in a -95.04% discount on shares I sold for $40.36 on January 26, 2021.
The buy also raised my per-share "cost" +$0.35 from -$2.55 to -$2.20 (a negative per-share cost indicates all capital has been removed in addition to $2.20 per share added to the portfolio’s bottom line in addition to each share’s current value).
From here, my next buy target is $1.30, a price calculated using the Fibonacci Method, and my next sell target is $41.00, slightly below SPCE's first all-time high in February 2020.
SPCE closed the week at $2.05, up +2.50% from where I added on Tuesday.
Zillow (Z): Profit-Taking
Between the overvalued and potentially weakening residential real estate sector and the fact Zillow (Z) was losing support this week, I decided to take profits and reduce my exposure with a sell order which went through on Thursday at $48.91.
While the order only locked in +2.56% in gains and lowered my per-share cost just -1.26% from $48.30 to $47.69, it served the more important purpose of mitigating risk. Given that Zillow hit a low of $26.14 less than a year ago, it felt prudent to reduce my allocation just in case we head into that kind of weakness again.
From here, my next buy target is $31.21, a point of support has seen many times in the past, and I will hold the remainder of my position until we see where the economy takes us from here.
Z closed the week at $47.43, down -3.03% from where I took profits Thursday.