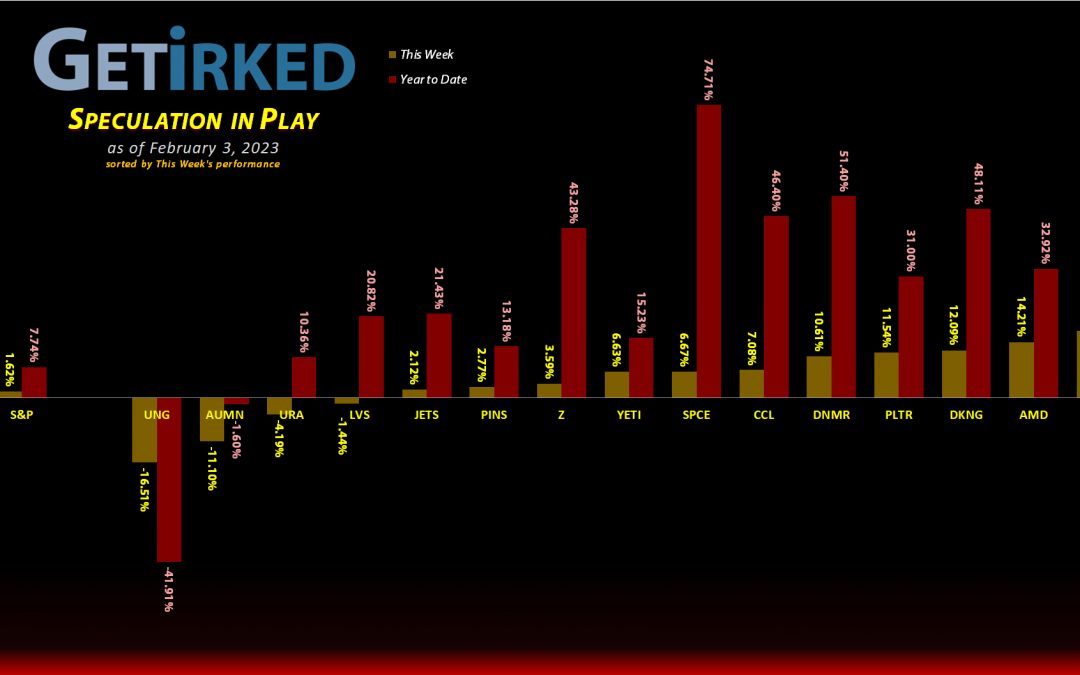
February 3, 2023
Risk Disclaimer
The positions in this portfolio are incredibly risky and extremely volatile.
No one at Get Irked is a professional financial adviser (or a doctor), so consult with your own financial adviser to see if any of these positions fit your risk profile (and stomach).

Click image to bring up larger version.
The Week's Biggest Winner & Loser
GrowGeneration (GRWG)
There must be a rumbling about cannabis over in Washington D.C. because all of the pot stocks started popping this week. In this portfolio, that means GrowGeneration (GRWG) jumped +17.03%, earning itself the spot of the Week's Biggest Loser.
U.S. Natural Gas (UNG)
The fact that the U.S. Natural Gas Fund (UNG) was down -16.51%, nearly -77% from its highs last AUGUST, is the reason it's even here. When UNG kept plunging this week, breaking down to new all-time lows, I knew it was time to open a position in this Week's Biggest Loser (read more below).
Portfolio Allocation
Positions
%
Target Position Size

Click image to bring up larger version.
Portfolio Breakdown

Click image to bring up larger version.
Year-to-Date Performance
Current Position Performance
AMD (AMD)
+565.04%*
1st Buy: 1/10/2019 @ $19.54
Current Per-Share: -($135.01)*
Yeti (YETI)
+395.68%*
1st Buy: 2/26/2019 @ $23.23
Current Per-Share: (-$45.80)*
Pinterest (PINS)
+376.78%*
1st Buy: 5/16/2019 @ $25.72
Current Per-Share: -($29.14)*
Virgin Galactic (SPCE)
+174.20%*
1st Buy: 10/31/2019 @ $9.87
Current Per-Share: (-$3.60)*
Las Vegas Sands (LVS)
+169.19%*
1st Buy: 8/12/2021 @ $40.50
Current Per-Share: -($10.44)*
Carnival Cruise (CCL)
+159.20%
1st Buy: 3/12/2020 @ $17.25
Current Per-Share: $4.56
Airlines ETF (JETS)
+84.27%*
1st Buy: 5/14/2020 @ $11.30
Current Per-Share: (-$2.68)*
Uranium ETF (URA)
+25.49%
1st Buy: 2/23/2021 @ $17.97
Current Per-Share: $17.66
U.S. Natural Gas (UNG)
-7.03%
1st Buy: 1/30/2023 @ $9.30
Current Per-Share: $8.80
Zillow (Z)
-7.05%
1st Buy: 11/18/2021 @ $57.13
Current Per-Share: $49.65
Golden Mine. (AUMN)
-36.40%
1st Buy: 7/29/2021 @ $0.5316
Current Per-Share: $0.4277
DraftKings (DKNG)
-43.57%
1st Buy: 1/29/2021 @ $52.97
Current Per-Share: $29.90
Palantir (PLTR)
-47.42%
1st Buy: 2/12/2021 @ $31.50
Current Per-Share: $16.00
SPY 3/3 400-398 Puts
-48.49%
Cost: $0.7442
Current Value: $0.38
Canadian Pal (DCNNF)
-52.25%
1st Buy: 7/19/2021 @ $0.1000
Current Per-Share: $0.0691
Grow Gen. (GRWG)
-65.30%
1st Buy: 10/30/2020 @ $16.04
Current Per-Share: $15.65
Danimer Sci (DNMR)
-68.30%
1st Buy: 10/20/2021 @ $15.00
Current Per-Share: $8.55
Fabled Gold (FBSGD)
-83.31%
1st Buy: 7/23/2021 @ $0.5180
Current Per-Share: $0.4135
* Indicates a position where the capital investment was sold.
Profit % for * positions = Current Total Profit / Original Capital Investment
This Week’s Moves
U.S. Natural Gas (UNG): *Opened Position*
On Monday, I decided to open a position in the U.S. Natural Gas (UNG) fund when the price of natural gas dropped to lows not seen since April 2021, only a little more than 10% off its all-time bottom. The price of natural gas has dropped a staggering -76.81% since August... yes, August 2022... making it one of the most hated commodities out there.
To paraphrase Warren Buffett, buy what everyone hates, sell what everyone loves. Accordingly, I scaled into a position on Monday with orders filling at $9.30 and $9.25 giving me a per-share cost of $9.28. After UNG appeared to bottom on Wednesday at $8.41, I added some more on Thursday when it retested that low at $8.43, lowering my per-share cost -3.02% from $9.28 to $9.00.
UNG's death spiral continued on Friday when it crashed through its all-time low. Since I always plan for possibilities, not probabilities, my next buying target was $8.20, below UNG's $8.22 all-time low, and that's where I got hit, with another buy lowering my per-share cost another -2.22% from $9.00 to $8.80, a total reduction of of -5.38% from where I first opened the position at $9.30 on Monday.
From here, my next buy target is $7.22, a price set using the Fibonacci Method, and my next sell target is $11.02, quite a bit below a repeated point of resistance from the past.
UNG closed the week at $8.18, down -7.05% from my $8.80 average price.
Want Further Clarification?
As always, if you have questions about any of my positions or have positions of your own that you're curious about - feel free to leave a comment below!See you next week!
Ways to give back to GetIrked:
Send me a tip via Stripe! Thank you!
Get free money by signing up for an account with my referral link for Schwab
Sign up for Gemini and we each get $10
Click this referral link to get the Brave Browser
If you use Brave, you can also use the Tip function to tip me in Basic Attention Token (BAT).
![]()
Disclaimer: Eric "Irk" Jacobson and all other Get Irked contributors are not investment or financial advisers. All strategies, trading ideas, and other information presented comes from non-professional, amateur investors and traders sharing techniques and ideas for general information purposes.
As always, all individuals should consult their financial advisers to determine if an investing idea is right for them. All investing comes with levels of risk with some ideas and strategies carrying more risk than others.
As an individual investor, you are accountable for assessing all risk to determine if the strategy or idea fits with your investment style. All information on Get Irked is presented for educational and informational purposes only.
You must be logged in to post a comment.