November 17, 2023
The Week’s Biggest Winner & Loser
Block / Square (SQ)
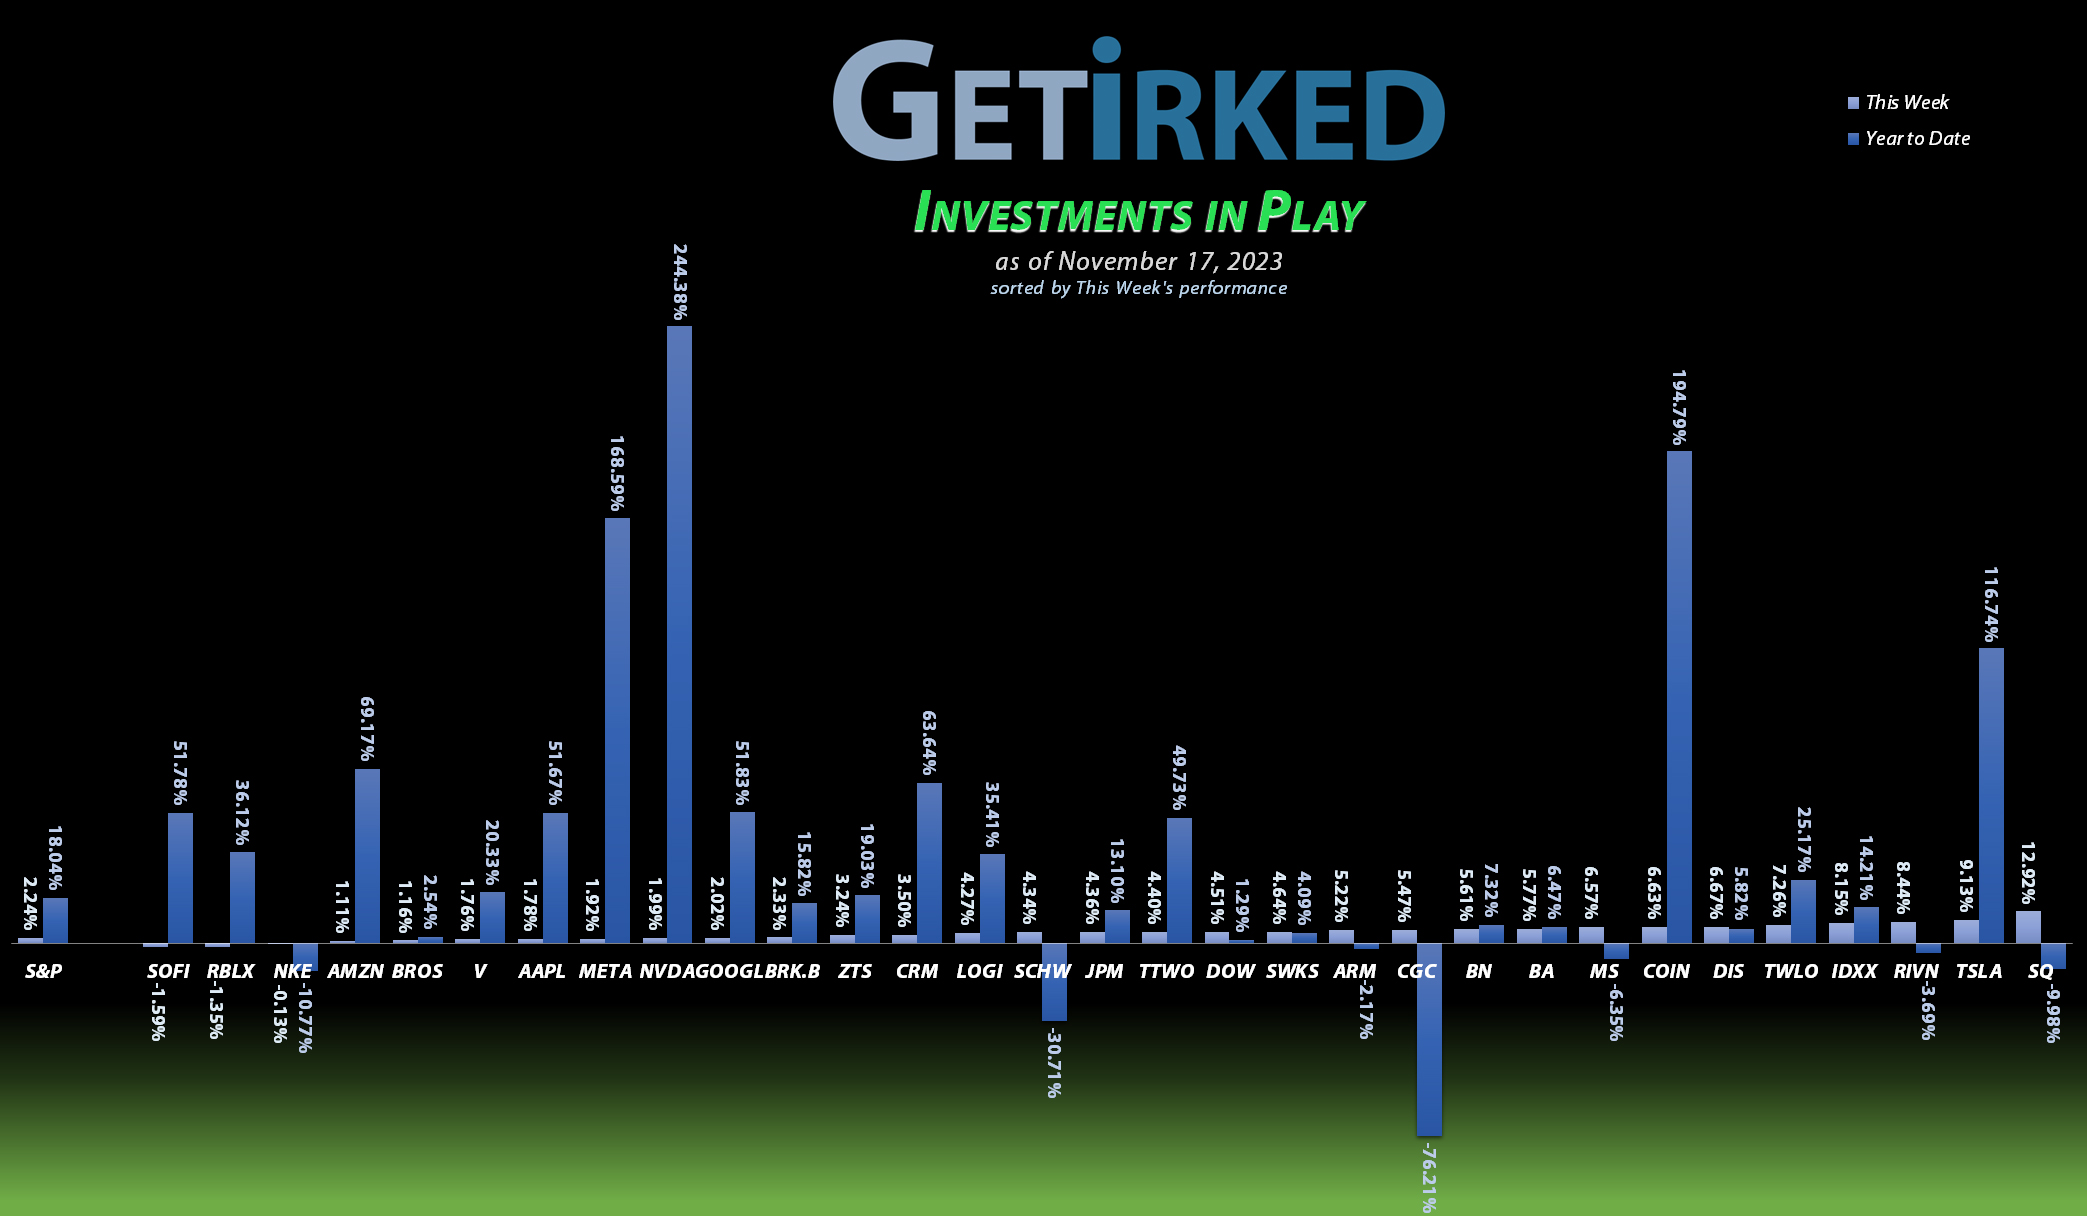
It was a tale of two fintechs this week when Block, the artist formerly known as Square (SQ), rocketed higher. Between the market-wide rally and Block’s blowout earnings report, it seems investors re-discovered this best-of-breed fintech, sending the stock up +12.92% on the week and landing in as the Week’s Biggest Winner.
SoFi (SOFI)
It was the best of fintech… it was the worst of fintech. Whereas the market selected Block (SQ) as the market darling, investors shunned fintech company SoFi (SOFI), sending the stock down -1.59% for the week. While that doesn’t sound like a big loss, during a week where nearly every stock rallied, any loss is bad, and SOFI garnered the largest loss of the portfolio, earning it the spot of the Week’s Biggest Loser.
Portfolio Allocation
Positions
%
Target Position Size
Current Position Performance
Nvidia (NVDA)
+1568.92%*
1st Buy 9/6/2016 @ $15.67
Current Per-Share: (-$321.45)*
Apple (AAPL)
+977.03%*
1st Buy 4/18/2013 @ $14.17
Current Per-Share: (-$77.48)*
Logitech (LOGI)
+706.21%*
1st Buy 11/11/2016 @ $24.20
Current Per-Share: -($5.63)*
Boeing (BA)
+679.64%*
1st Buy 2/14/2012 @ $79.58
Current Per-Share: (-$179.40)*
Tesla (TSLA)
+610.22%*
1st Buy 3/12/2020 @ $37.10
Current Per-Share: (-$48.28)*
Block (SQ)
+497.04%*
1st Buy 8/5/2016 @ $11.10
Current Per-Share: (-$63.41)*
Skyworks (SWKS)
+443.36%*
1st Buy 1/31/2020 @ $113.60
Current Per-Share: (-$34.48)*
Nike (NKE)
+418.97%*
1st Buy 2/14/2012 @ $26.71
Current Per-Share: (-$10.49)*
IDEXX Labs (IDXX)
+418.95%*
1st Buy 7/26/2017 @ $167.29
Current Per-Share: (-$220.95)*
Dow (DOW)
+306.77%*
1st Buy 5/13/2019 @ $53.18
Current Per-Share: (-$0.32)*
JP Morgan (JPM)
+287.44%
1st Buy 10/26/2017 @ $102.30
Current Per-Share: $39.45
Amazon (AMZN)
+196.28%
1st Buy 2/6/2018 @ $69.15
Current Per-Share: $49.00
Disney (DIS)
+162.69%*
1st Buy 2/14/2012 @ $41.70
Current Per-Share: (-$2.23)*
Salesforce (CRM)
+150.86%
1st Buy 6/11/2018 @ $134.05
Current Per-Share: $88.20
Take Two (TTWO)
+130.61%
1st Buy 10/9/2018 @ $128.40
Current Per-Share: $66.95
Meta (META)
+101.72%*
1st Buy 9/16/2017 @ $128.58
Current Per-Share: -($323.00)*
Berkshire (BRK.B)
+91.18%
1st Buy 8/2/2019 @ $199.96
Current Per-Share: $187.77
SoFi (SOFI)
+79.75%
1st Buy 11/22/2022 @ $4.80
Current Per-Share: $3.80
Alphabet (GOOGL)
+65.01%
1st Buy 9/16/2022 @ $101.93
Current Per-Share: $82.00
Visa (V)
+43.76%
1st Buy 5/9/2022 @ $194.00
Current Per-Share: $173.60
Zoetis (ZTS)
+22.94%
1st Buy 6/13/2022 @ $157.55
Current Per-Share: $142.19
Morgan Stan (MS)
+18.08%
1st Buy 4/25/2022 @ $83.50
Current Per-Share: $68.02
Brookfield (BN)
+6.01%
1st Buy 9/25/2023 @ $32.44
Current Per-Share: $31.95
Arm Hldgs (ARM)
+3.46%
1st Buy 9/14/2023 @ $57.28
Current Per-Share: $53.15
Schwab (SCHW)
-10.82%
1st Buy 4/18/2022 @ $76.30
Current Per-Share: $63.68
Roblox (RLBX)
-11.38%
1st Buy 9/29/2021 @ $77.00
Current Per-Share: $42.80
Dutch Bros (BROS)
-15.99%
1st Buy 9/20/2021 @ $42.25
Current Per-Share: $33.15
Twilio (TWLO)
-30.19%
1st Buy 8/8/2019 @ $125.71
Current Per-Share: $90.40
Rivian (RIVN)
-42.21%
1st Buy 11/12/2021 @ $127.00
Current Per-Share: $28.90
Coinbase (COIN)
-52.38%
1st Buy 4/14/2021 @ $412.47
Current Per-Share: $208.00
Canopy (CGC)
-86.08%
1st Buy 5/24/2018 @ $29.53
Current Per-Share: $3.95
* Indicates a position where the capital investment was sold.
Profit % for * positions = Total Profit / Starting Capital Investment
A negative share price indicates the dollar amount of profit for each share currently held.
This Week’s Moves
JP Morgan Chase (JPM): Profit-Taking
Last week’s overpowering rally was so strong that even the beaten-up financials got taken higher. JP Morgan Chase (JPM), the best-in-breed in the space, saw huge gains, hitting my next sell target on Friday which sold 8.74% of the position at $152.81, locking in +15.21% on shares I bought for $132.64 on January 24, 2020.
The sale lowered my per-share cost -20.08% from $49.36 to $39.45. From here, my next sell target is $159.37, just underneath the next point of resistance, and my next buy target is $101.82, above the low JP Morgan saw in 2022.
JPM closed the week at $152.82, +$0.01 from where I took profits on Friday.
Logitech (LOGI): Profit-Taking
When the markets rallied on a cooler-than-expected CPI print Tuesday morning, Logitech (LOGI) triggered my next sell order, selling 2.56% of my allocation at $83.51 and locking in +88.83% in gains on shares bought for $44.23 on October 2, 2018.
The sale lowered my per-share “cost” -$1.46 from -$3.35 to -$5.63 (a negative per-share cost indicates all capital has been removed in addition to $5.63 per share added to the portfolio’s bottom line in addition to each share’s current value).
I’m a huge fan of Logitech – both the company and its products – however, this monster has seen a huge rally. In fact, it’s up more than +57% just since June. Accordingly, I felt it was time to reduce my allocation by trimming, even though the position is nowhere close to exceeding my target allocation size. From here, my next sell target is $94.92, slightly below a past point of resistance, and my next buy target is $54.14, above the low Logitech saw in June 2023.
LOGI closed the week at $85.05, up +1.84% from where I took profits Tuesday.
Morgan Stanley (MS): Dividend Reinvestment
Morgan Stanley (MS) paid out its quarterly dividend on Wednesday, which, after reinvestment, lowered my per-share cost -1.06% from $68.75 down to $68.02. Thanks to the impressive support it found above my cost basis in its last selloff, I’ve raised my next buy target on MS to $69.46.
However, since the financial sector, in general, and Morgan Stanley, specifically, have proven to be incredibly volatile later, I will take profits if MS makes a try for a recent point of resistance with my next sell target at $88.91.
Nvidia (NVDA): Profit-Taking
Naturally, Nvidia (NVDA) was one of the biggest movers after the cooler-than-expected CPI was released Tuesday morning, rocketing through my next sell order which filled at $496.42, selling 7.60% of my allocation, and locking in +3,067.96% in gains on shares I bought for $15.67 when I initially opened the position on September 6, 2016.
The sale lowered my per-share cost -$62.17, down from -$259.28 to -$321.45 (a negative per-share cost indicates all capital has been removed in addition to $321.45 per share added to the portfolio’s bottom line in addition to each share’s current value).
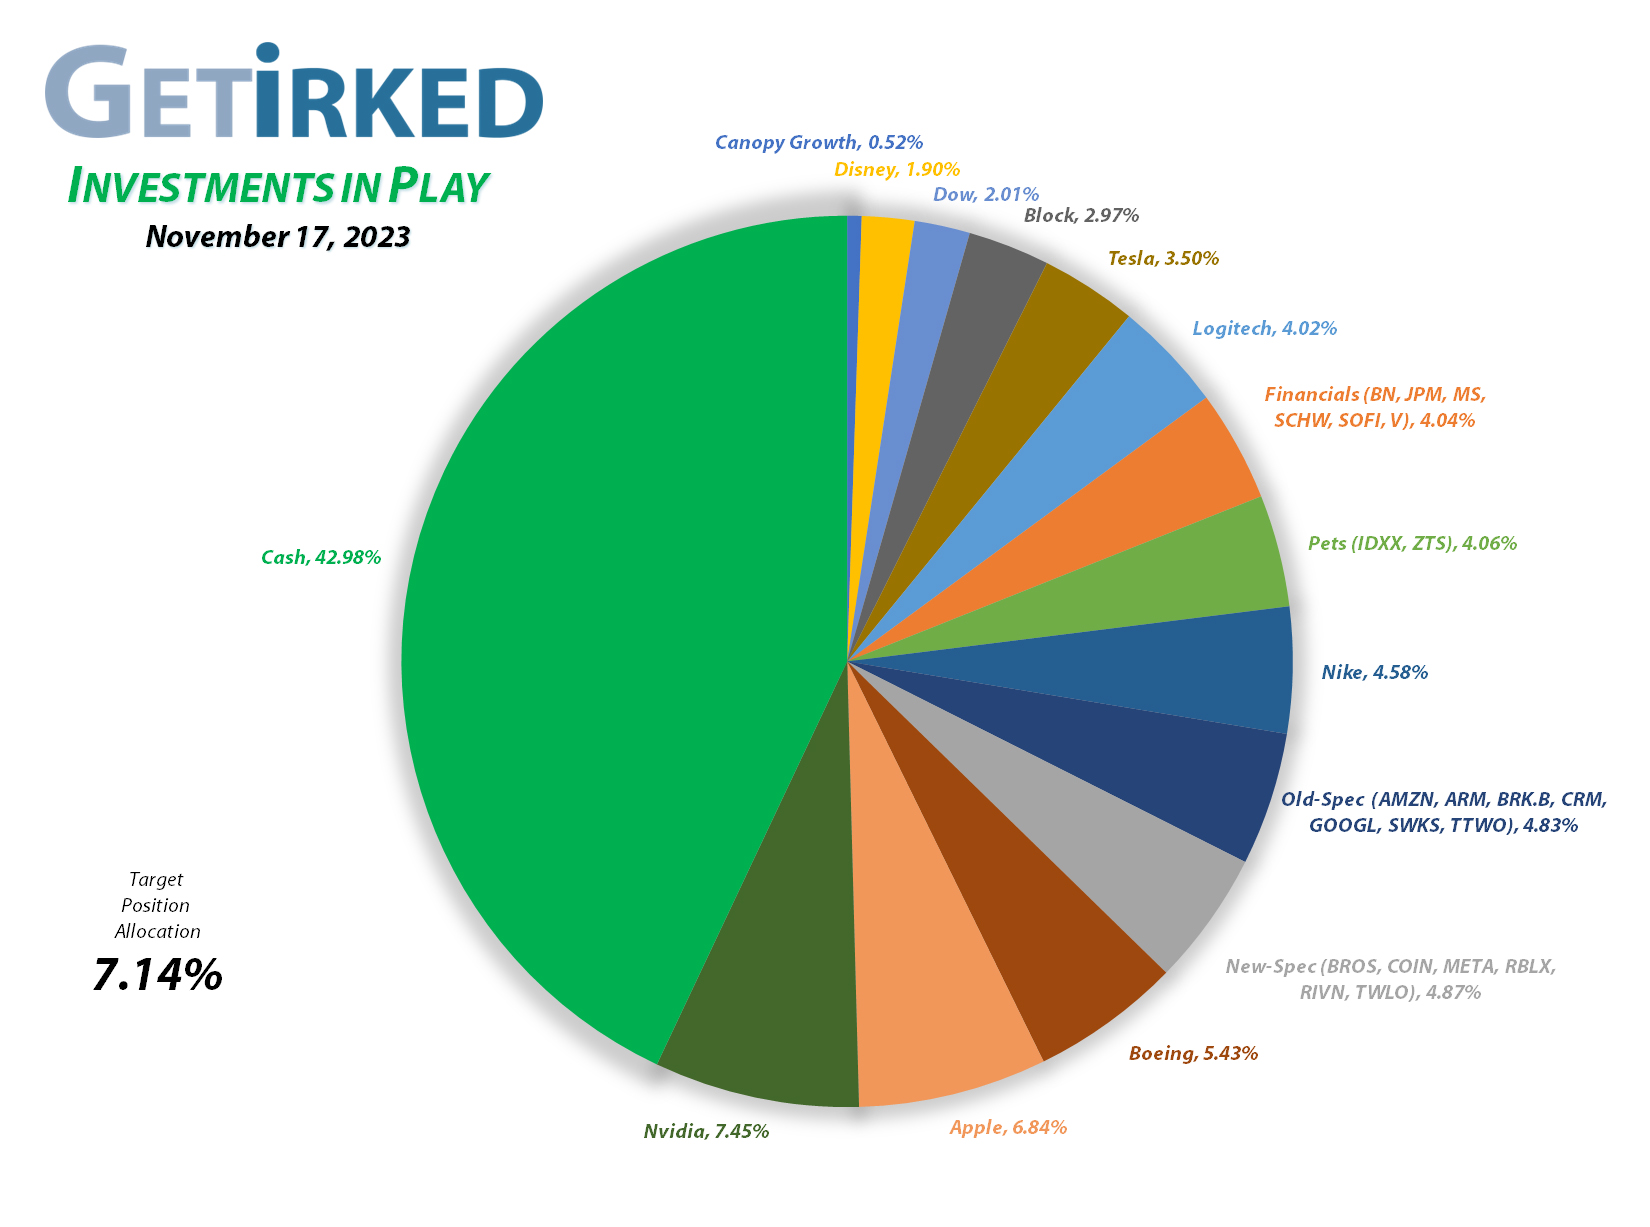
To be clear, I’m obviously still long-term bullish on Nvidia and believe in it for the long-term, however, with Nvidia reporting earnings next week, I felt it was more than prudent to take profits. Particularly, since, despite taking profits, Nvidia not only remains the biggest position in the portfolio, it is still overweight at 7.51% in a portfolio where the target position allocation is 7.14%.
My next sell target is tentatively set at $599.36, below the $600 price target some more bullish analysts have for the stock, and my next buy target is $322.47 a price calculated using Fibonacci Retracement, and right around a past point of support.
NVDA closed the week at $492.98, down -0.69% from where I took profits Tuesday.
See you next week!
Ways to give back to GetIrked:
Send me a tip via Stripe! Thank you!
Get free money by signing up for an account with my referral link for Schwab
Sign up for Gemini and we each get $10
Click this referral link to get the Brave Browser
If you use Brave, you can also use the Tip function to tip me in Basic Attention Token (BAT).

Disclaimer: Eric “Irk” Jacobson and all other Get Irked contributors are not investment or financial advisers. All strategies, trading ideas, and other information presented comes from non-professional, amateur investors and traders sharing techniques and ideas for general information purposes.
As always, all individuals should consult their financial advisers to determine if an investing idea is right for them. All investing comes with levels of risk with some ideas and strategies carrying more risk than others.
As an individual investor, you are accountable for assessing all risk to determine if the strategy or idea fits with your investment style. All information on Get Irked is presented for educational and informational purposes only.


You must be logged in to post a comment.