June 30, 2023

Click above image for larger version
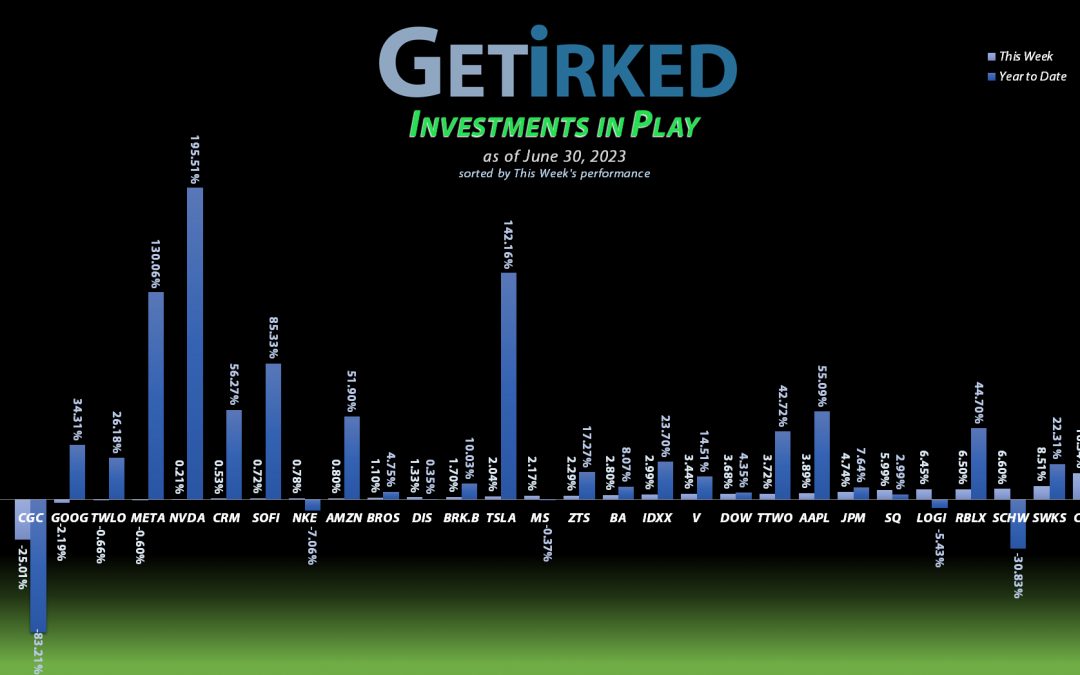
The Week's Biggest Winner & Loser
Rivian (RIVN)
Rivian (RIVN) drove in as this Week's Biggest Winner as analyst coverage indicated that things may not be as bad as feared for the fledgling EV maker. As a result, Rivian popped +23.32%. We'll just ignore the fact it's still down Year-to-Date.
Canopy Growth Corp (CGC)
At this point, Canopy Growth Corporation (CGC) is simply a documentary of everything a company can do wrong. This week, Canopy's accounting firm resigned - yes, they can do that. Then, to add insult to injury, CGC executed an equity listing to raise funds, further devaluing the existing shares. As a result, Canopy collapsed another -25.01% in what was a generally good week, easily landing in the spot of the Week's Biggest Loser for the second week in a row.
Portfolio Allocation
Positions
%
Target Position Size

Click above image for larger version
Portfolio Breakdown

Click above image for larger version
Year-to-Date Performance
Current Position Performance
Nvidia (NVDA)
+1406.26%*
1st Buy 9/6/2016 @ $15.67
Current Per-Share: (-$162.57)*
Apple (AAPL)
+991.70%*
1st Buy 4/18/2013 @ $14.17
Current Per-Share: (-$77.58)*
Boeing (BA)
+684.92%*
1st Buy 2/14/2012 @ $79.58
Current Per-Share: (-$179.40)*
Tesla (TSLA)
+669.54%*
1st Buy 3/12/2020 @ $37.10
Current Per-Share: (-$48.28)*
Block (SQ)
+523.33%*
1st Buy 8/5/2016 @ $11.10
Current Per-Share: (-$75.30)*
Skyworks (SWKS)
+497.54%*
1st Buy 1/31/2020 @ $113.60
Current Per-Share: (-$34.72)*
Logitech (LOGI)
+493.54%*
1st Buy 11/11/2016 @ $24.20
Current Per-Share: -($0.81)*
IDEXX Labs (IDXX)
+442.53%*
1st Buy 7/26/2017 @ $167.29
Current Per-Share: (-$220.95)*
Nike (NKE)
+432.08%*
1st Buy 2/14/2012 @ $26.71
Current Per-Share: (-$10.52)*
Disney (DIS)
+193.20%
1st Buy 2/14/2012 @ $41.70
Current Per-Share: $30.45
Salesforce (CRM)
+139.52%
1st Buy 6/11/2018 @ $134.05
Current Per-Share: $88.20
JP Morgan (JPM)
+120.61%
1st Buy 10/26/2017 @ $102.30
Current Per-Share: $65.92
Take Two (TTWO)
+119.81%
1st Buy 10/9/2018 @ $128.40
Current Per-Share: $66.95
SoFi (SOFI)
+98.58%
1st Buy 11/22/2022 @ $4.80
Current Per-Share: $4.20
Amazon (AMZN)
+94.58%
1st Buy 2/6/2018 @ $69.15
Current Per-Share: $67.00
Meta (META)
+94.29%*
1st Buy 9/16/2017 @ $128.58
Current Per-Share: -($323.00)*
Dow (DOW)
+86.22%
1st Buy 5/13/2019 @ $53.18
Current Per-Share: $28.60
Berkshire (BRK.B)
+81.61%
1st Buy 8/2/2019 @ $199.96
Current Per-Share: $187.77
Visa (V)
+36.56%
1st Buy 5/9/2022 @ $194.00
Current Per-Share: $173.93
Morgan Stan (MS)
+32.74%
1st Buy 4/25/2022 @ $83.50
Current Per-Share: $64.34
Alphabet (GOOGL)
+26.60%
1st Buy 9/16/2022 @ $101.93
Current Per-Share: $94.55
Zoetis (ZTS)
+20.88%
1st Buy 6/13/2022 @ $157.55
Current Per-Share: $142.46
Roblox (RLBX)
-10.26%
1st Buy 9/29/2021 @ $77.00
Current Per-Share: $44.90
Schwab (SCHW)
-11.37%
1st Buy 4/18/2022 @ $76.30
Current Per-Share: $63.95
Dutch Bros (BROS)
-18.01%
1st Buy 9/20/2021 @ $42.25
Current Per-Share: $34.70
Twilio (TWLO)
-29.62%
1st Buy 8/8/2019 @ $125.71
Current Per-Share: $90.40
Rivian (RIVN)
-44.09%
1st Buy 11/12/2021 @ $127.00
Current Per-Share: $29.80
Coinbase (COIN)
-65.60%
1st Buy 4/14/2021 @ $412.47
Current Per-Share: $208.00
Canopy (CGC)
-90.30%
1st Buy 5/24/2018 @ $29.53
Current Per-Share: $4.00
* Indicates a position where the capital investment was sold.
Profit % for * positions = Total Profit / Starting Capital Investment
A negative share price indicates the dollar amount of profit for each share currently held.
This Week's Moves
Apple (AAPL): Profit-Taking
It was time to take profits in one of my portfolio's oldest and most beloved positions, Apple (AAPL), when it crossed over the whopping $3 trillion market cap line on Friday and exceeded the 7.14% maximum allocation size for the portfolio with a sell order that filled at $191.65.
The sale locked in +304.07% in gains on shares I bought for $47.43 on 11/14/2018 and lowered my per-share cost -13.09% from -$68.60 to -$77.58 (a negative per-share cost indicates all capital has been removed in addition to $77.58 per share added to the portfolio’s bottom line in addition to each share’s current value).
My next sell target is $213.75, a price calculated using Fibonacci Retracement and also a point where Apple will dramatically exceed the target allocation size for the portfolio. My next buy target is $139.21, above a past point of repeated support.
AAPL closed the week at $193.97, up +1.21% from where I took profits Friday.
See you next week!
Ways to give back to GetIrked:
Send me a tip via Stripe! Thank you!
Get free money by signing up for an account with my referral link for Schwab
Sign up for Gemini and we each get $10
Click this referral link to get the Brave Browser
If you use Brave, you can also use the Tip function to tip me in Basic Attention Token (BAT).
You must be logged in to post a comment.