July 23, 2021
The Week’s Biggest Winner & Loser
Square (SQ)
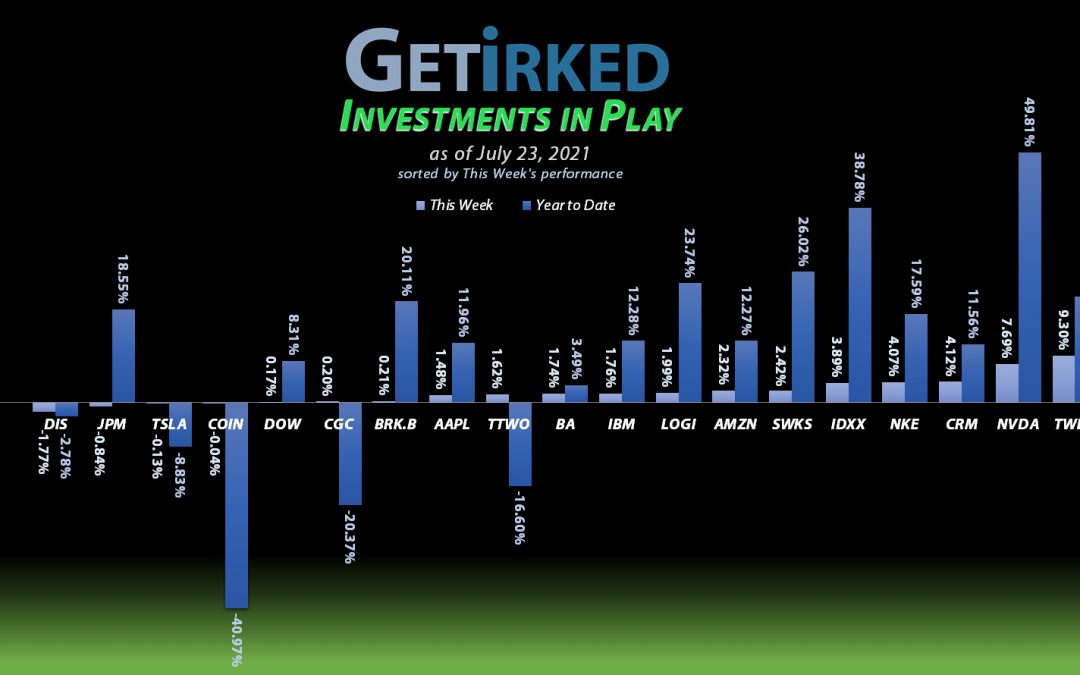
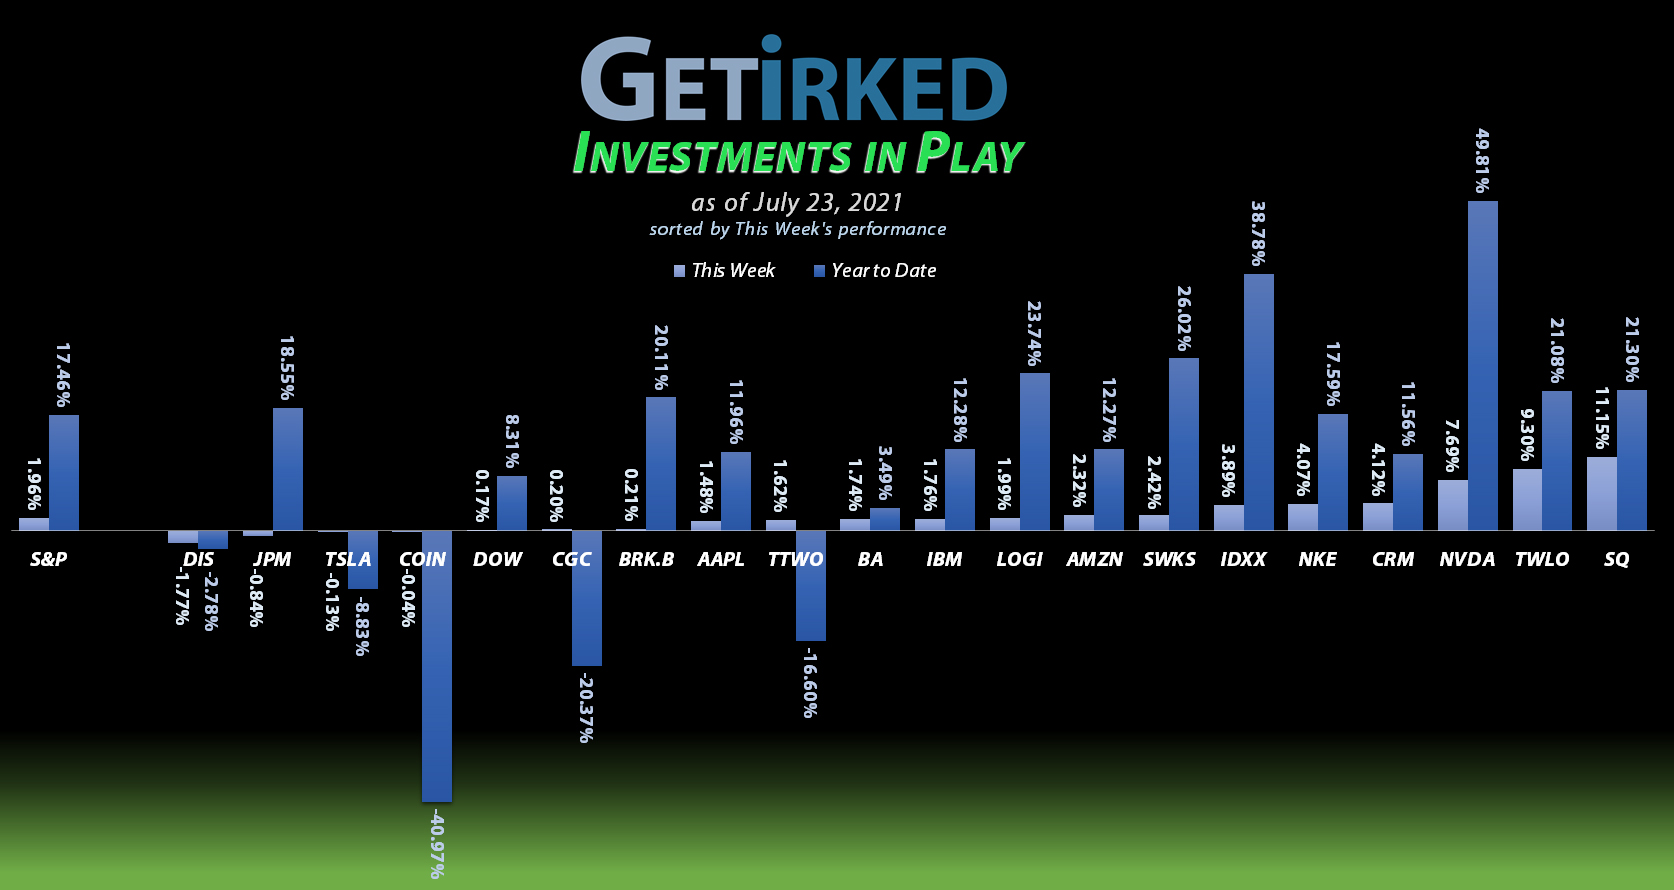
When the rates on the 10-year treasury fall, the traditional financials do poorly but fintech companies like Square (SQ) and PayPal (PYPL) excel. This week was no different with Square locking in a +11.15% weekly gain to earn itself the Week’s Biggest Winner spot.
Disney (DIS)
With the treacherous rise of the delta Covid-19 variant, reopening plays that depend on big audiences, like Disney (DIS), took it on the chin. DIS dipped -1.77% this week, a pretty negligible drop, but still enough to earn itself the spot of the Week’s Biggest Loser.
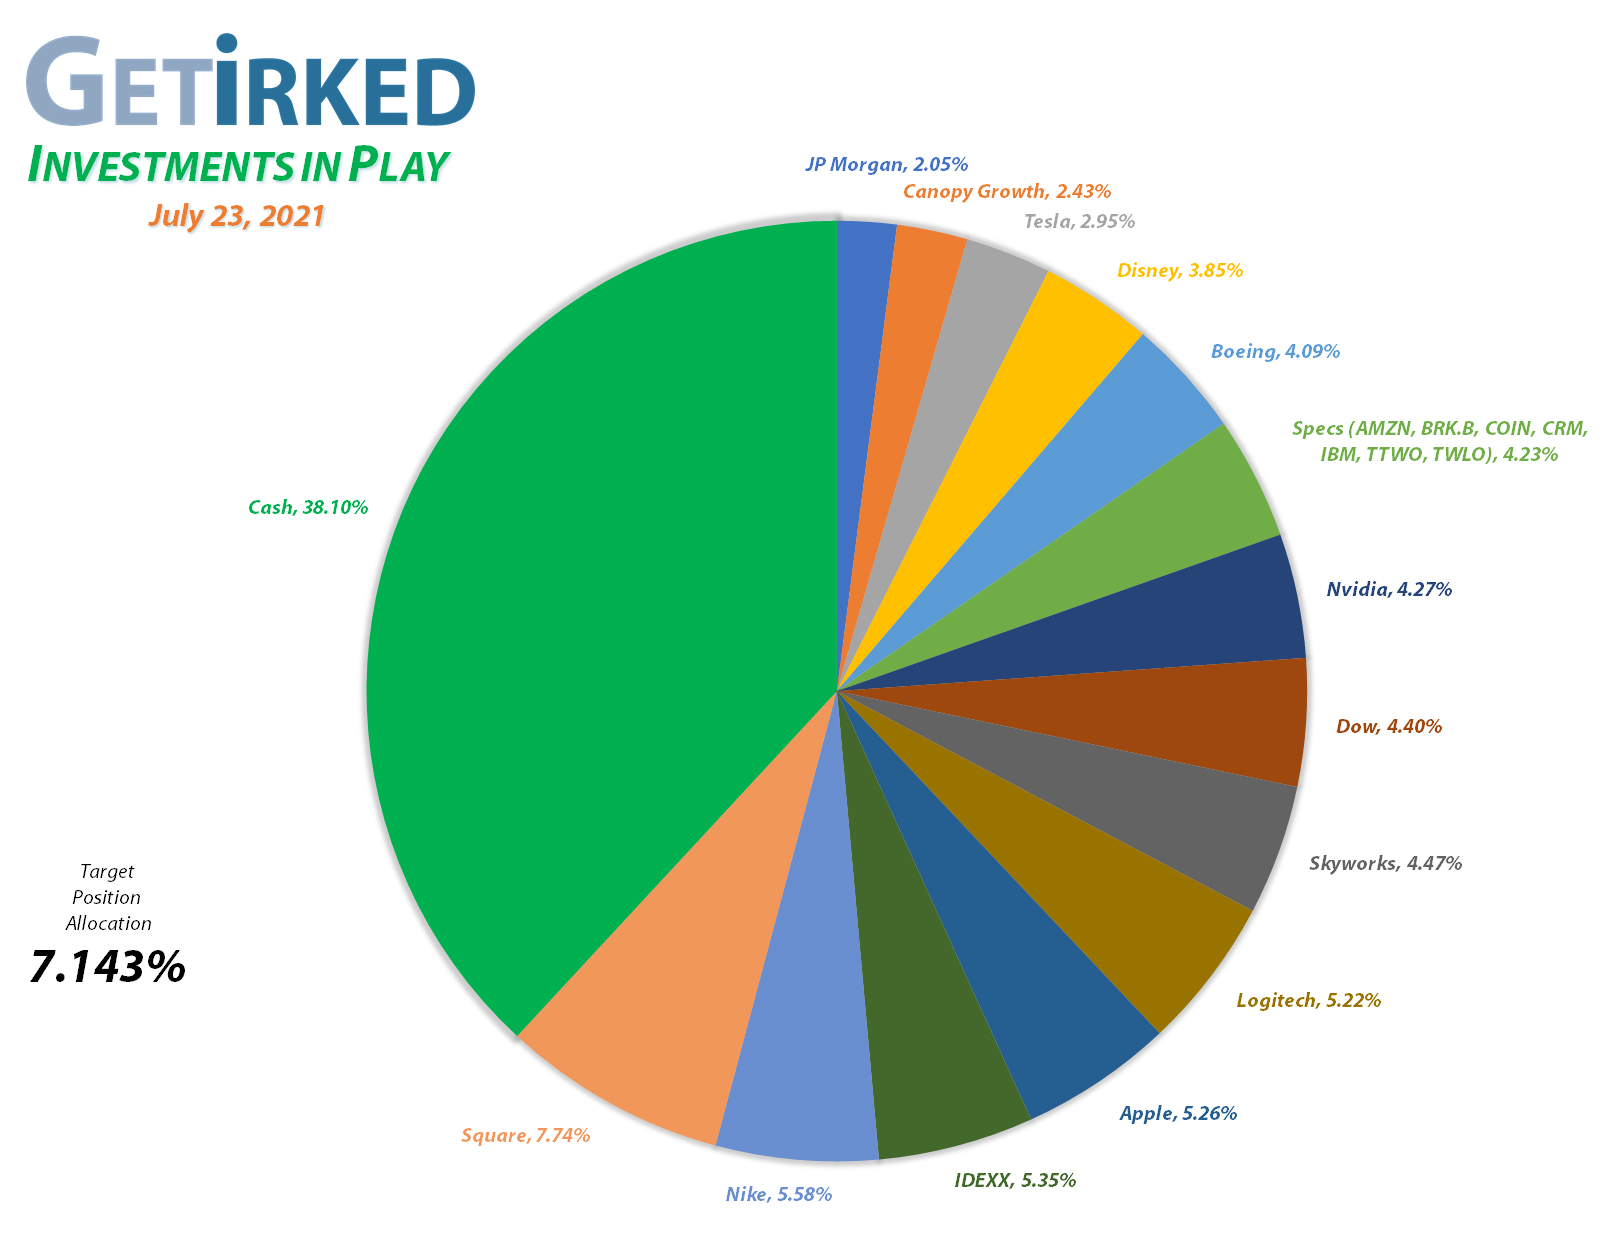
Portfolio Allocation
Positions
%
Target Position Size
Current Position Performance
Take Two (TTWO)
+2751.61%
1st Buy 10/9/2018 @ $128.40
Current Per-Share: $6.30
Square (SQ)
+1110.52%*
1st Buy 8/5/2016 @ $11.10
Current Per-Share: (-$148.56)*
Logitech (LOGI)
+1004.61%*
1st Buy 11/11/2016 @ $24.20
Current Per-Share: (-$2.29)*
Apple (AAPL)
+794.98%*
1st Buy 4/18/2013 @ $14.17
Current Per-Share: (-$44.94)*
Nvidia (NVDA)
+705.54%*
1st Buy 9/6/2016 @ $15.77
Current Per-Share: (-$25.68)*
Boeing (BA)
+686.18%*
1st Buy 2/14/2012 @ $79.58
Current Per-Share: (-$261.81)*
Canopy (CGC)
+684.80%
1st Buy 5/24/2018 @ $29.53
Current Per-Share: $2.50
Nike (NKE)
+611.23%*
1st Buy 2/14/2012 @ $26.71
Current Per-Share: (-$24.66)*
IDEXX Labs (IDXX)
+607.55%*
1st Buy 7/26/2017 @ $167.29
Current Per-Share: (-$32.76)*
Tesla (TSLA)
+566.01%*
1st Buy 3/12/2020 @ $111.30
Current Per-Share: (-$102.03)*
Disney (DIS)
+368.28%*
1st Buy 2/14/2012 @ $41.70
Current Per-Share: (-$0.04)*
Amazon (AMZN)
+288.12%*
1st Buy 2/6/2018 @ $1,382.96
Current Per-Share: -($4,999.10)*
Twilio (TWLO)
+225.96%*
1st Buy 8/8/2019 @ $125.71
Current Per-Share: (-$16.25)*
Skyworks (SWKS)
+133.12%
1st Buy 1/31/2020 @ $113.60
Current Per-Share: $82.65
Salesforce (CRM)
+115.49%
1st Buy 6/11/2018 @ $134.05
Current Per-Share: $115.20
JP Morgan (JPM)
+109.14%
1st Buy 10/26/2017 @ $102.30
Current Per-Share: $72.03
IBM (IBM)
+104.68%
1st Buy 11/6/2018 @ $120.87
Current Per-Share: $69.06
Berkshire (BRK.B)
+69.84%
1st Buy 8/2/2019 @ $199.96
Current Per-Share: $163.97
Dow (DOW)
+69.09%
1st Buy 5/13/2019 @ $53.18
Current Per-Share: $35.55
Coinbase (COIN)
-41.50%
1st Buy 4/14/2021 @ $412.47
Current Per-Share: $384.45
* Indicates a position where the capital investment was sold.
Profit % for * positions = Total Profit / Starting Capital Investment
A negative share price indicates the dollar amount of profit for each share currently held.
This Week’s Moves
Square (SQ): Profit-Taking
Friday was once again profit-taking time for Square (SQ) as it started to test an upper-trend line of resistance. A sell order filled at $261.85, locking in +32.11% in gains on shares I bought a little over two months ago for $198.20 on May 13.
The sale also “lowered” my per-share cost -10.95% from -$133.90 to -$148.56, meaning each share adds $148.56 in profits to the portfolio’s bottom line. From here, my next sell target is near Square’s all-time high of $283.19 and my next buy target is $193.25, near a past point of support.
SQ closed the week at $264.00, up +0.82% from where I sold on Friday.
Want Further Clarification?
As always, if you have questions about any of my positions or have positions of your own that you’re curious about – feel free to leave a comment below!
See you next week!
Ways to give back to GetIrked:
Send me a tip via Stripe! Thank you!
Get free money by signing up for an account with my referral link for Schwab
Sign up for Gemini and we each get $10
Click this referral link to get the Brave Browser
If you use Brave, you can also use the Tip function to tip me in Basic Attention Token (BAT).


You must be logged in to post a comment.