
Click on the chart to enlarge it for a bigger view
I Didn’t Beat the Markets This Year… or did I??
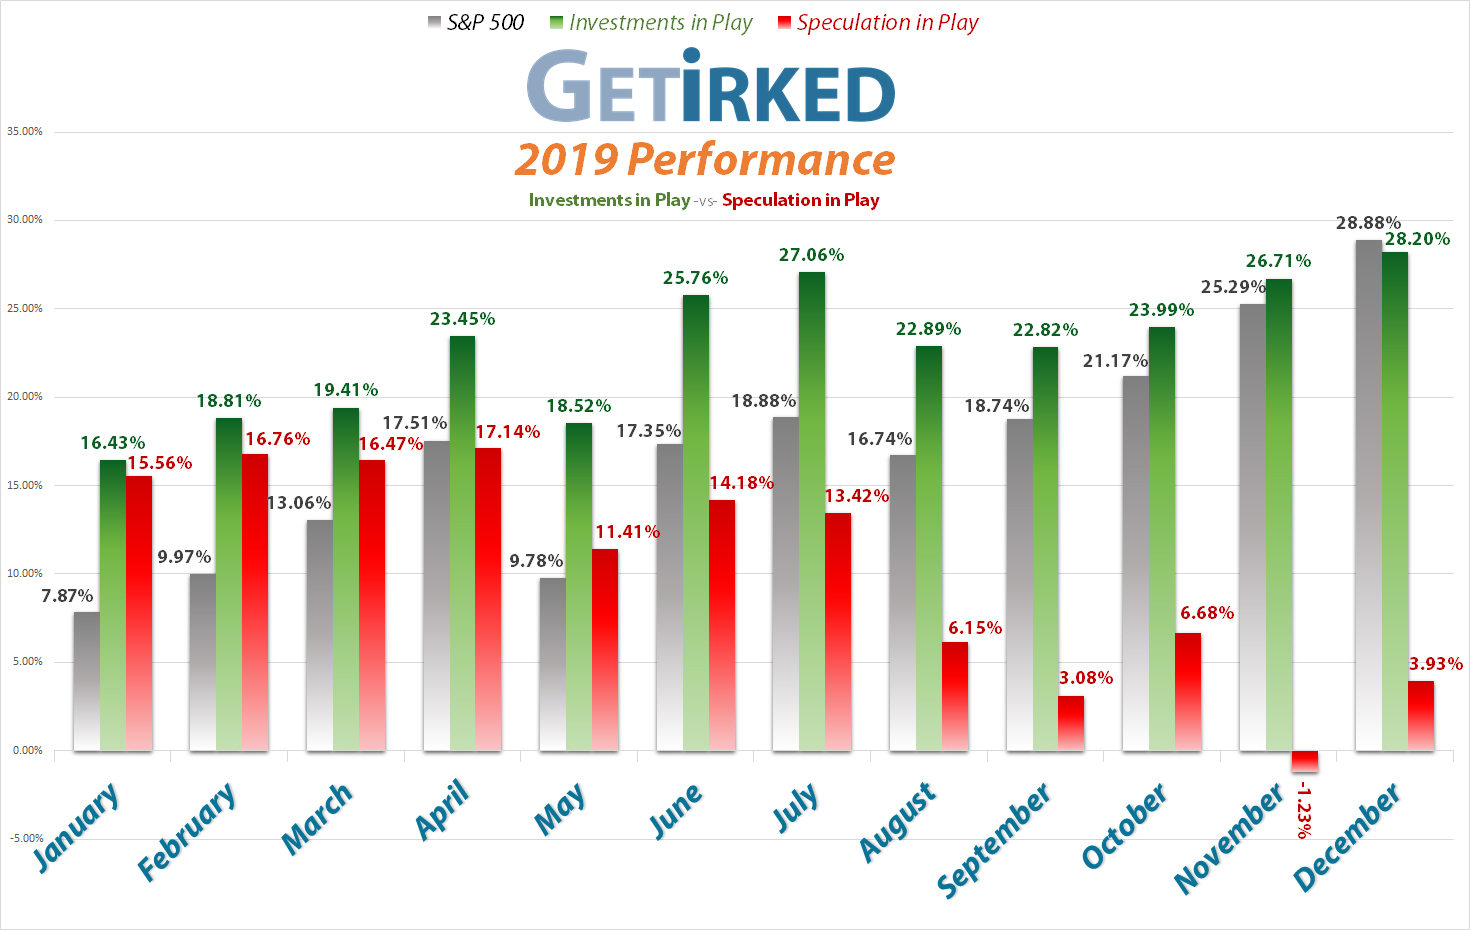
This year, I fought the market and the market won, but just barely. Where the S&P 500 earned an astounding +28.88% for the year, my Investments in Play portfolio only brought home 28.20% in gains, a miss of -0.68%.
Let’s look at a two-year comparison, eh?
Okay, the idea is to try and beat the markets each and every year, and that certainly didn’t happen for me in 2019. However, if you look at a two-year comparison, the picture definitely changes.
From January 1, 2018 to December 31, 2019, the S&P 500 gained 20.215% even including the 2018’s fourth-quarter disaster. However, thanks to my techniques and specific stock choices, my Investments in Play portfolio is up 28.953% over the same time, a gain of +8.738% over the S&P 500’s performance. Of course, I’ll try to beat the pants off the market in 2020, but I’m not unhappy with my year-over-year performance.
My Speculation in Play portfolio also performed admirably, in my opinion, finishing the year up nearly 4% after being devastated in November. Given the nature of speculative investing, I fully expect that my Speculation in Portfolio will either substantially underperform or dramatically outperform the markets with little in-between.
As for what dragged down my Investments in Play portfolio’s performance, I’m not at all disappointed in my portfolio’s performance given two key substantially negative events (discussed below) that wreaked havoc on a handful of my positions.
Boeing, Boeing, Boeing
After suffering two tragic airline crashes in just over six months killing 300 people, Boeing (BA) had a bad year with its best-selling model, the 737-Max, grounded indefinitely. In fact, production is supposed to be suspended starting in just a few days from the writing of this article.
The year only got worse as (ex-)CEO Dennis Muilenburg fumbled every possible step along the way. From wildly-inaccurate predictions of when the plane would return to service to horrifying news releases about how shoddy the workmanship was going into certain components to pissing off the FAA and eventually getting fired, CEO Muilenburg failed in every possible way to properly handle the crisis.
Boeing’s lack of transparency throughout the entire crisis combined with an apparent lack of knowledge as to what was specifically going on resulted in Boeing’s stock losing more than 25% in value from its 52-week high and earning just 1.01% for the entire year, but given what a cluster the year was, it’s pretty surprising Boeing was up at all.
Cannabis goes up in smoke.
The consumer cannabis sector completely imploded over the summer thanks to overwhelming supply and underwhelming demand. The Cannabis Collapse was particularly bad to my Speculation in Play portfolio where I held more than a half dozen different positions in the sector.
Talk about learning a lesson in the importance of diversification, am I right?
How bad was it?
Canopy Growth Corp (CGC) collapsed a staggering -73.18% from its yearly high of $52.74 on April 30 before bottoming at $13.81 on Nov 19.
To make matters worse, the collapse in consumer cannabis also took out a second position in my Investments in Play portfolio, GW Pharmaceuticals (GWPH). Despite being a biopharmaceutical company, GWPH is regularly included in consumer cannabis ETFs and gets destroyed whenever they do.
The collapse evaporated my CGC position, losing all of the gains I had in the stock at one point, with GWPH ending the year entirely underwater. GWPH saw its all-time high of $196.00 on May 7 get positively killed for -51.17% before it hit its $95.71 low on Nov 26.
How did Buying and Selling in Stages do in 2019?
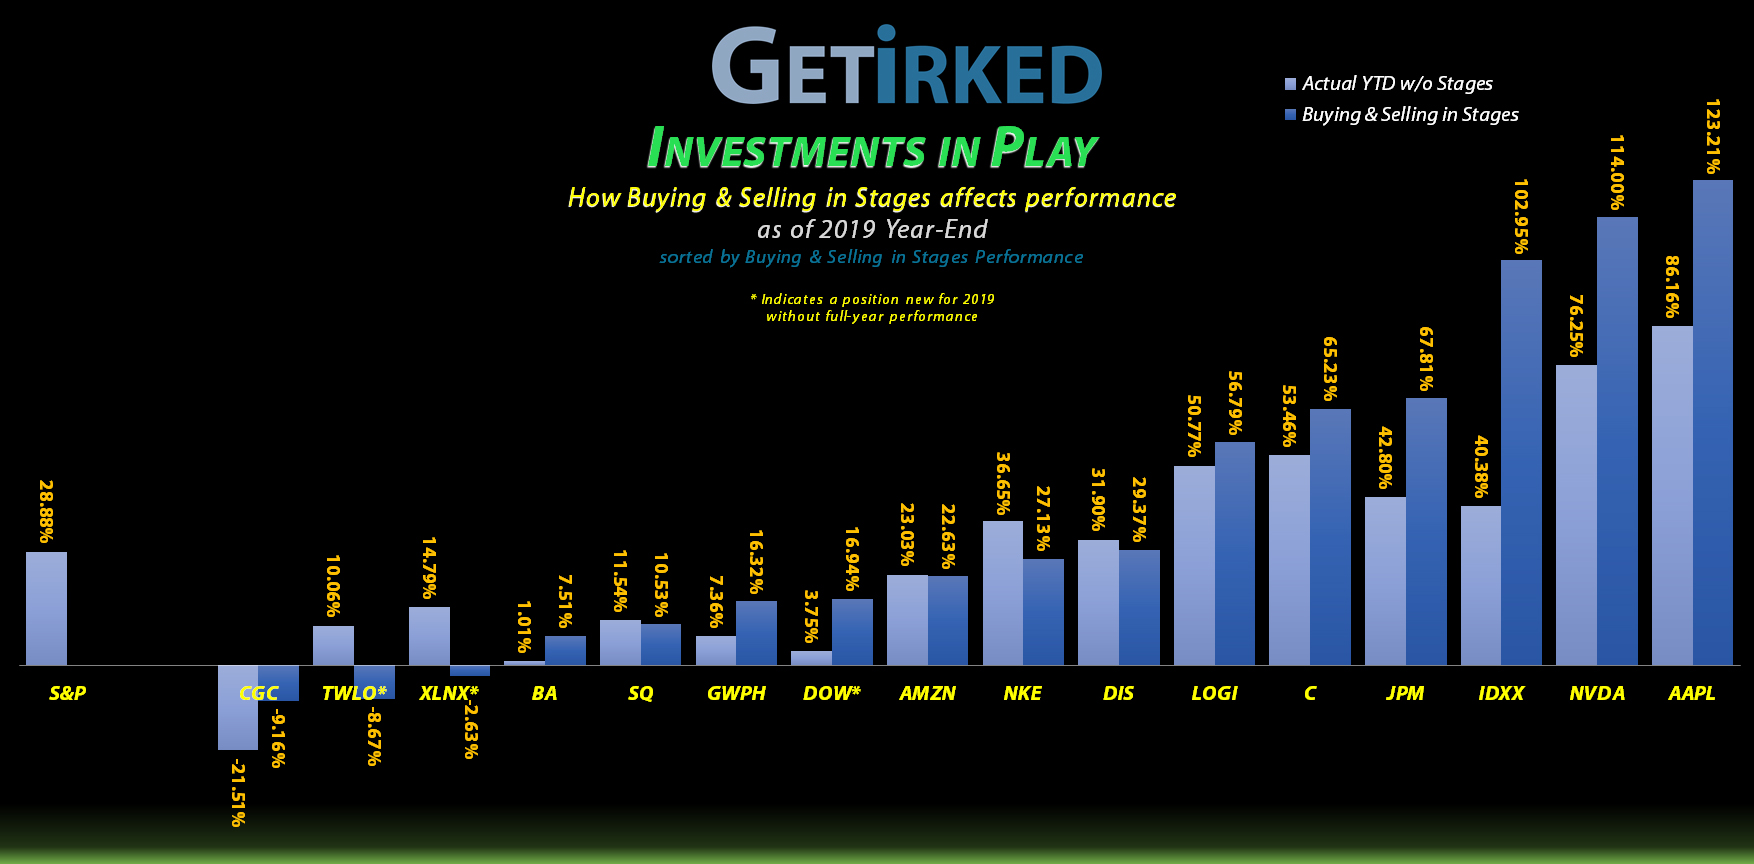
The below chart shows the overall performance of my Investments in Play portfolio in two ways – the light blue bar shows how the position fared if an investor bought at the beginning of the year and held for the entire year.
The dark blue bar shows how I fared by buying and selling in stages using the market’s volatile swings throughout the year.
The calculation of the performance in Buying in Stages and Selling in Stages is based on the profit of my position from the beginning of the year to the end. In other words, adding more to a position wouldn’t help improve its gain unless the overall profit after costs gained.
Likewise, ending the year with a smaller position with greater profits would still result in a lesser % gain as holding the entire position would have been more effective.
The below chart shows each position’s year-end performance. For positive positions, a higher dark-blue bar indicates the Stage approach was more effective at producing larger gains. For negative positions, a lesser bar (i.e. a smaller loss) indicates the Stages approach was more effective at mitigating losses.
Click on the chart to enlarge it for a bigger view
Top 3 Buying & Selling Winners
#1 IDEXX Laboratories (IDXX)
Despite seeing a lesser overall gain than both my #2 and #3 performers, Nvidia and Apple, the spread between Buying and Selling in Stages and what the stock did if I just held it is what makes IDEXX Labs my #1 performer this year. If I had held IDXX for the year, I would be up +40.38% right now. However, by capitalizing on the market’s incredibly volatile moves, I added an additional +62.57% to my gains, more than doubling the just-holding technique and netting an extra +102.95% for the year.
#2 Nvidia (NVDA)
By Buying and Selling Nvidia (NVDA) in Stages, I earned an extra +37.75% for a total of +114% versus the +76.25% I would have earned holding the position for the year.
#3 Apple (AAPL)
By Buying and Selling Apple (AAPL) in Stages throughout the year, I was able to earn an additional +37.05% in gains for a total of +123.21% over just holding it throughout the year which would have netted a still-amazing +86.16%
Greatest Loss Reduction: Canopy Growth Corp (CGC)
Buying and Selling in Stages doesn’t just work in profitable stocks, it can also substantially mitigate losses. This year, I only have one long-term position (not new to the portfolio in 2019) that was down for the year (fortunately), and that was good ol’ Canopy Growth Corporation (CGC).
Along with the rest of the cannabis cohort, Canopy Growth completely collapsed mid-year, destroying some truly epic gains and turning the entire position down for the year. By selling in stages when Canopy Growth was at much higher levels, I was able to reduce a potential -21.51% loss for the year by 12.35%, losing -9.16% for the year, instead.
Why does the strategy work? The key part is Selling in Stages. By taking profits when you have them, you reduce your per-share cost while also freeing up capital to reapply to the position as the stock price falls (if you dare… mwahahahah).
Top 3 Buying & Selling Losers
For the losers, I picked stocks that I held all year. Twilio (TWLO) and Xilinx (XLNX) were both opened this year at higher levels than the year’s start disqualifying them for consideration in both the Winner and Loser categories along with Dow Chemical (DOW), another new position to the portfolio in 2019.
This section is really eye-opening to how powerful Buying and Selling in Stages can be to improve overall performance. Out of the 13 qualified positions held for the entire year, 9 of them saw bigger gains or lesser losses when compared with buying-and-holding. Only 4 of my positions saw worse performance than buying-and-holding.
Also, the difference between what I made and what I could have made in these “losers” is marginal with the greatest profit miss of -9.52% in Nike gains dwarfed by the extra +40.38% I was able to earn in IDEXX above.
Biggest Loser #1: Nike (NKE)
Nike (NKE)’s performance this year was so outstanding that it caught many long-term investors off-guard, myself included. At least twice during the year, I took profits where I thought Nike would retreat only to see it have larger gains as it blew away analyst expectations repeatedly. This excellent performer brought +36.65% in gains to investors who just bought-and-held it where my Stages Technique reduced my gains by -9.52% to a still-respectable +27.13% for the year.
Biggest Loser #2: Disney (DIS)
Even when Disney (DIS) announced its Disney+ streaming service early in 2019, who would’ve thought they would also so thoroughly dominate the box office, earning 40% of all box office revenue in 2019 with multiple billion-dollar blockbusters?!
Disney had been in a trading range between $100-$120 for nearly five years and now it’s broken out, grabbing +31.90% for the year. I took profits a little early and my position missed out on 2.53% of the gains, reducing my year-end profits slightly to +29.37%. Still better than a sharp stick in the eye.
Biggest Loser #3: Square (SQ)
As far as long-term positions go, Square (SQ) is one of my most volatile. This year, I missed out on fully capitalizing on some of the volatility, so rather than earning +11.54% if I had just bought and held, I missed out on 1.01% which reduced my year-end gains to +10.53%, still better than the 6-7% target average return for a portfolio.
Per-Share Cost Reduction
For me, progress isn’t just defined by the gain/loss for a position. It’s also defined by how much I reduced the per-share cost of my positions by taking advantage of the year’s volatility by Selling in Stages when I have profits and Buying in Stages when the market affords me the proper opportunity.
Believe it or not, I actually find managing positions where I have large profits more difficult than positions where I have little or no profits. When the stock’s price is so far from per-share cost, it can be particularly difficult to calculate when a good adding opportunity may be (take particular note of the moves in Canopy Growth Corporation (CGC) and GW Pharmaceuticals (GWPH) for examples of this).
Check out all of the specific moves in each of my holdings performed in 2019 below including changes to per-share cost for the year.
Moves in Current Holdings Throughout 2019:
Amazon.com
(AMZN)
$1,847.84
Annual Changes
Gain/Loss Per-Share Cost
+22.63% -1.31%
Jan: $1,637.35 Dec: $1,615.85
Moves
1/22/2019: Sell 50.00% @ $1,658.84
Boeing
(BA)
$325.76
Annual Changes
Gain/Loss Per-Share Cost
+7.51% -218.36%
Jan: -$229.75 Dec: -$731.41
Moves
1/29/2019: Sell 19.25% @ $364.92
2/7/2019: Sell 15.90% @ $403.31
2/27/2019: Sell 18.90% @ $429.72
3/26/2019: Buy 11.57% @ $375.40
4/9/2019: Sell 41.49% @ $368.29
5/13/2019: Buy 17.73% @ $343.09
12/16/2019: Buy 9.70% @ $329.86
Citigroup
(C)
$79.89
Annual Changes
Gain/Loss Per-Share Cost
+65.23% -15.09%
Jan: $64.42 Dec: $54.70
Moves
3/26/2019: Buy 14.13% @ $61.29
4/3/2019: Sell 12.38% @ $64.61
5/1/2019: Sell 28.26% @ $69.92
9/13/2019: Sell 19.40% @ $70.38
11/4/2019: Sell 4.81% @ $75.21
12/13/2019: Sell 5.02% @ $77.06
12/27/2019: Sell 5.29% @ $80.00
Dow Chemical
(DOW)
$54.73
Annual Changes
Gain/Loss Per-Share Cost
+16.94% -12.00%
May: $53.18 Dec: $46.80
Moves
5/3/2019: Opened 23.12% @ $53.18
5/13/2019: Buy 22.48% @ $51.32
5/23/2019: Buy 21.57% @ $49.21
5/30/2019: Buy 14.86% @ $48.24
5/31/2019: Buy 16.67% @ $47.44
7/15/2019: Sell 22.01% @ $50.58
8/1/2019: Buy 28.23% @ $47.45
8/5/2019: Buy 23.69% @ $44.63
9/16/2019: Sell 10.63% @ $49.82
9/17/2019: Sell 19.52% @ $48.18
11/18/2019: Sell 4.85% @ $54.52
IDEXX Labs
(IDXX)
$261.13
Annual Changes
Gain/Loss Per-Share Cost
+102.95% -24.29%
Jan: $154.36 Dec: $116.86
Moves
1/22/2019: Sell 33.33% @ $199.07
5/3/2019: Sell 10.00% @ $248.06
7/10/2019: Sell 11.11% @ $287.97
12/16/2019: Buy 7.52% @ $255.74
Nike
(NKE)
$101.31
Annual Changes
Gain/Loss Per-Share Cost
+27.13% -684.51%
Jan: -$7.88 Dec: -$61.82
Moves
1/25/2019: Sell 14.19% @ $80.72
2/11/2019: Sell 16.53% @ $83.40
3/26/2019: Buy 18.38% @ $83.74
9/23/2019: Sell 16.45% @ $87.67
11/19/2019: Sell 8.53% @ $94.95
12/13/2019: Sell 4.26% @ $97.39
Nvidia
(NVDA)
$235.30
Annual Changes
Gain/Loss Per-Share Cost
+114.00% -167.82%
Jan: $68.00 Dec: -$46.12
Moves
1/22/2019: Sell 49.62% @ $153.90
5/23/2019: Buy 13.02% @ $147.69
11/18/2019: Buy 14.26% @ $212.17
12/13/2019: Sell 16.63% @ $225.61
Twilio
(TWLO)
$98.28
Annual Changes
Gain/Loss Per-Share Cost
-8.67% -14.40%
Aug: $125.71 Dec: $107.61
Moves
8/8/2019: Opened 16.39% @ $125.71
9/9/2019: Buy 15.11% @ $114.52
10/18/2019: Buy 9.17% @ $105.44
10/23/2019: Buy 8.65% @ $100.50
10/31/2019: Buy 11.84% @ $93.01
11/7/2019: Buy 3.86% @ $90.96
Apple
(AAPL)
$293.65
Annual Changes
Gain/Loss Per-Share Cost
+123.21% -274.76%
Jan: $90.70 Dec: -$158.51
Moves
2/6/2019: Sell 10.07% @ $174.81
3/22/2019: Sell 17.75% @ $195.20
5/6/2019: Sell 40.62% @ $207.76
5/13/2019: Buy 19.63% @ $187.46
9/30/2019: Sell 8.15% @ $223.78
10/11/2019: Sell 8.87% @ $235.04
10/28/2019: Sell 10.53% @ $248.27
12/13/2019: Sell 10.75% @ $272.98
Canopy Growth Corporation (CGC)
$21.09
Annual Changes
Gain/Loss Per-Share Cost
-9.16% -23.85%
Jan: $24.57 Dec: $18.71
Moves
1/14/2019: Sell 33.33% @ $37.72
1/29/2019: Sell 20.00% @ $48.14
5/23/2019: Buy 17.00% @$43.78
9/16/2019: Buy 5.33% @ 26.90
10/2/2019: Buy 8.13% @ $20.76
11/14/2019: Buy 6.02% @ $15.66
11/21/2019: Sell 2.00% @ $19.83
11/21/2019: Sell 2.04% @ $20.52
11/21/2019: Sell 2.08% @ $21.35
11/29/2019: Sell 4.26% @ $19.05
12/9/2019: Sell 2.22% @ $20.99
12/10/2019: Sell 2.27% @ $21.49
12/18/2019: Buy 1.73% @ $19.64
Disney
(DIS)
$144.63
Annual Changes
Gain/Loss Per-Share Cost
+29.37% -172.20%
Jan: -$2.23 Dec: -$15.25
Moves
2/7/2019: Sell 16.02% @ $110.38
10/2/2019: Buy 12.64% @ $128.19
11/14/2019: Sell 5.61% @ $148.29
GW Pharmaceuticals
(GWPH)
$104.56
Annual Changes
Gain/Loss Per-Share Cost
+16.32% -16.60%
Jan: $142.57 Dec: $118.90
Moves
1/20/2019: Sell 57.14% @ $142.00
2/5/2019: Sell 20.00% @ $148.91
2/8/2019: Sell 16.67% @ $144.18
2/22/2019: Sell 20.00% @ $151.95
2/27/2019: Sell 37.50% @ $170.63
5/6/2019: Sell 20.00% @ $179.84
6/27/2019: Buy 14.53% @ $165.12
9/20/2019: Buy 16.95% @ $128.60
9/30/2019: Buy 15.29% @ $115.95
11/6/2019: Buy 13.89% @ $109.12
11/25/2019: Buy 8.60% @ $97.58
JP Morgan Chase
(JPM)
$139.40
Annual Changes
Gain/Loss Per-Share Cost
+67.81% -17.55%
Jan: $105.38 Dec: $86.89
Moves
2/14/2019: Sell 19.70% @ $101.43
5/1/2019: Sell 24.37% @ $115.15
10/15/2019: Sell 13.24% @ $119.10
11/12/2019: Sell 15.12% @ $129.22
12/13/2019: Sell 8.92% @ $138.26
Logitech
(LOGI)
$47.16
Annual Changes
Gain/Loss Per-Share Cost
+56.79% -6.82%
Jan: $34.04 Dec: $31.72
Moves
1/25/2019: Sell 16.55% @ $36.14
4/9/2019: Sell 11.01% @ $40.28
11/15/2019: Sell 4.44% @ $43.07
12/13/2019: Sell 2.33% @ $45.31
Square
(SQ)
$62.56
Annual Changes
Gain/Loss Per-Share Cost
+10.53% -33.15%
Jan: -$32.73 Dec: -$43.58
Moves
1/22/2019: Sell 25.00% @ $70.12
5/29/2019: Buy 28.01% @ $64.03
6/7/2019: Sell 12.50% @ $69.35
9/16/2019: Buy 12.27% @ $57.03
10/24/2019: Sell 2.58% @ $60.94
11/7/2019: Sell 2.81% @ $66.32
11/27/2019: Sell 2.63% @ $69.49
Xilinx
(XLNX)
$97.77
Annual Changes
Gain/Loss Per-Share Cost
-2.63% -10.00%
May: $111.57 Dec: $100.41
Moves
5/13/2019: Opened 21.46% @ $111.57
5/20/2019: Buy 11.58% @ $99.08
10/1/2019: Buy 10.54% @ $91.37
![]()
Disclaimer: Eric "Irk" Jacobson and all other Get Irked contributors are not investment or financial advisers. All strategies, trading ideas, and other information presented comes from non-professional, amateur investors and traders sharing techniques and ideas for general information purposes.
As always, all individuals should consult their financial advisers to determine if an investing idea is right for them. All investing comes with levels of risk with some ideas and strategies carrying more risk than others.
As an individual investor, you are accountable for assessing all risk to determine if the strategy or idea fits with your investment style. All information on Get Irked is presented for educational and informational purposes only.
You must be logged in to post a comment.